
Customer acquisition cost (CAC) is the single metric that reveals how efficiently your go-to-market engine runs. After analyzing dozens of SaaS companies across industries and funding stages, one pattern stands out consistently: most teams either overspend without realizing it, or benchmark themselves against data that no longer reflects market reality.
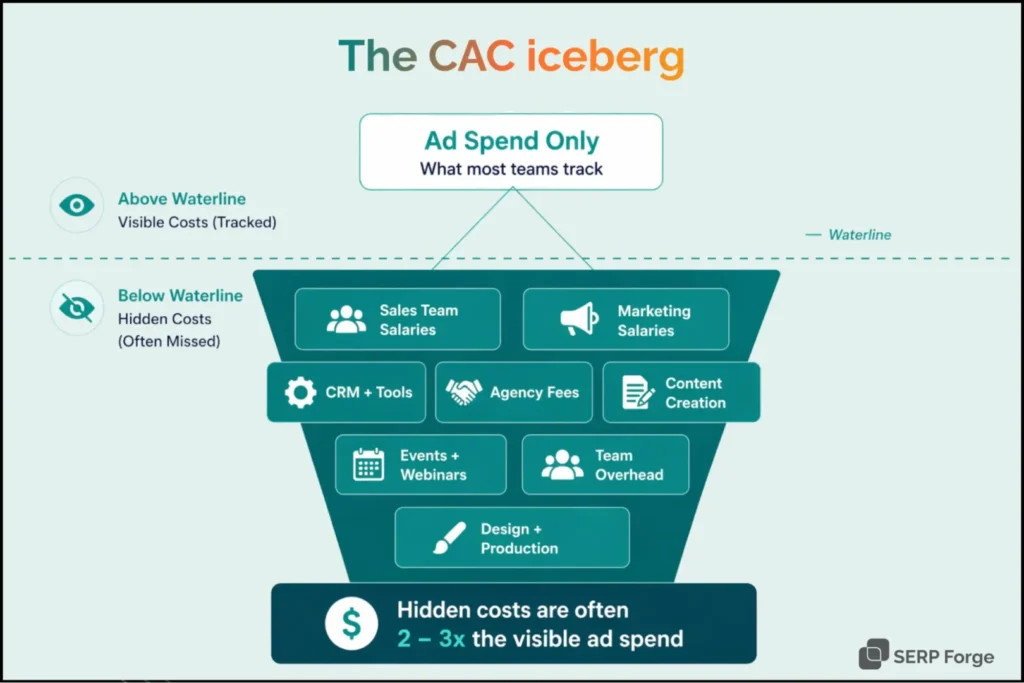
CAC is the total cost to acquire one paying customer. This includes sales salaries, marketing spend, tooling costs, and onboarding overhead. In 2026, rising ad platform CPCs, longer B2B sales cycles, and a more skeptical buyer market have reshaped what “good” looks like across every segment.
This guide breaks down SaaS CAC benchmarks across seven key dimensions: industry, growth stage, company size, acquisition channel, sales motion, deal size, and geography.
Each section includes real benchmarks, a clear data table, and honest signals for what healthy, average, and broken CAC looks like in each category.
SaaS CAC Benchmarks by Industry
Not all verticals carry the same acquisition cost. A cybersecurity platform sells into cautious enterprise procurement teams with multi-month evaluation cycles. A project management tool targets growth-stage teams that decide within days.
Industry context shapes every dollar you spend before a lead ever enters your pipeline.
In 2026, regulated verticals like healthcare SaaS and LegalTech continue to carry the highest acquisition costs. Long compliance review periods, specialized buyer personas, and limited targeting precision all inflate spend.
DevTools and EdTech retain lower CAC because buyers are technically literate, self-directed in their research, and comfortable with product-led onboarding.
| Industry | Average CAC | Best Practice CAC |
|---|---|---|
| Cybersecurity | $12,000 | $6,000 |
| Healthcare SaaS | $8,500 | $4,500 |
| LegalTech | $7,000 | $3,500 |
| FinTech | $4,200 | $2,000 |
| HRTech | $3,000 | $1,500 |
| MarTech | $2,200 | $1,000 |
| DevTools | $1,400 | $600 |
| EdTech | $900 | $400 |
Good CAC: DevTools and EdTech under $1,000 is strong, especially with typical ACVs in the $500–$2,000 range. Cybersecurity CAC at $6,000 is healthy when paired with ACV above $30,000.
Average CAC: FinTech and HRTech sitting between $3,000 and $4,000 reflects standard mid-market sales-led motion in these verticals.
Bad CAC: Cybersecurity spend above $12,000 without an LTV:CAC ratio above 3:1 signals a broken acquisition model. EdTech CAC exceeding $1,500 is almost always unsustainable given typical price points.
SaaS CAC Benchmarks by Growth Stage
Funding stage directly affects acquisition efficiency. Seed-stage teams rely on founder-led outreach, warm intros, and word-of-mouth. These channels carry minimal cost and naturally suppress CAC.
As companies scale into Series A and hire SDRs, account executives, and demand-gen marketers, costs rise sharply before any optimization kicks in.
Series B teams often experience the most volatile CAC period. They have repeatable GTM processes in early form, but channel efficiency is still being discovered. Series C and beyond see more predictable CAC as product-market fit is confirmed and the channel mix is locked in.
| Growth Stage | Average CAC | Best Practice CAC |
|---|---|---|
| Pre-Seed / Seed | $400 | $150 |
| Series A | $2,500 | $1,200 |
| Series B | $5,500 | $3,000 |
| Series C+ | $10,000 | $6,000 |
| Growth / Scale-up | $15,000 | $8,000 |
| Public / Enterprise | $40,000 | $20,000 |
Good CAC: Seed-stage CAC under $500 indicates genuine organic traction and a founder who knows their buyer. That is a strong foundation before committing to paid acquisition.
Average CAC: Series B companies landing between $4,000 and $6,000 while still refining their outbound playbook is standard and expected.
Bad CAC: Series A companies exceeding $4,000 CAC without a payback window under 18 months are burning capital before they have proof that their funnel scales.
SaaS CAC Benchmarks by Company Size
Targeting SMBs, mid-market firms, or enterprise accounts each demands a completely different go-to-market strategy and budget structure. SMB acquisition is volume-driven.
It depends on self-serve workflows, in-app nudges, and inside sales with short cycles. Enterprise acquisition is relationship-driven. It requires SDR prospecting sequences, multi-stakeholder demos, procurement negotiations, and executive involvement.
These differences produce a wide CAC gap even within the exact same SaaS vertical.
| Target Company Size | Average CAC | Best Practice CAC |
|---|---|---|
| SMB (1–50 employees) | $800 | $350 |
| Mid-Market (51–500) | $4,500 | $2,200 |
| Enterprise (501–5,000) | $18,000 | $9,000 |
| Strategic / Global Enterprise | $55,000 | $28,000 |
Good CAC: SMB-focused SaaS with CAC under $500 and a payback period under six months has a self-sustaining growth loop. That is a compounding advantage.
Average CAC: Mid-market CAC between $4,000 and $6,000 with a 12-month payback is the industry norm for sales-led SaaS targeting this segment in 2026.
Bad CAC: Enterprise CAC exceeding $25,000 without ACV above $80,000 destroys unit economics immediately. An LTV:CAC ratio below 2:1 signals a structural problem that no sales hire will fix.
SaaS CAC Benchmarks by Acquisition Channel
Channel benchmarks attract the most attention from growth and marketing teams because they represent the most direct lever for CAC reduction. Different channels produce vastly different cost-per-customer outcomes based on buyer intent, audience quality, and funnel conversion rates.
Paid search channels drive high-intent traffic but 2026 CPCs on Google and LinkedIn have increased 18–25% year-over-year. Organic content and SEO carry lower CAC but demand patience and sustained investment before compounding.
| Channel | Average CAC | Best Practice CAC |
|---|---|---|
| Organic Search (SEO) | $750 | $300 |
| Content Marketing | $900 | $400 |
| Paid Search (Google Ads) | $2,800 | $1,400 |
| Paid Social (LinkedIn) | $3,500 | $1,800 |
| Cold Email Outbound | $2,200 | $1,000 |
| Events / Conferences | $6,000 | $3,000 |
| Affiliate / Partner | $1,200 | $500 |
| Community-Led Growth | $600 | $250 |
Good CAC: Community-led growth and organic search consistently deliver the lowest CAC across all B2B SaaS categories in 2026. These channels build durable acquisition pipelines that grow without proportional budget increases.
Average CAC: Cold email outbound at $1,500–$2,500 remains a reliable mid-range acquisition channel when personalization and ICP targeting are dialed in correctly.
Bad CAC: LinkedIn paid ads exceeding $4,500 CAC without a remarketing and nurture sequence in place signal budget waste. Conference spending above $7,000 per acquired customer warrants a full pipeline audit.
SaaS CAC Benchmarks by Sales Motion
How you sell determines how much acquisition costs you carry. Product-led growth (PLG) keeps CAC low by letting the product drive conversion. Users explore, activate, and upgrade without human intervention. Sales-assisted models add targeted outreach at key conversion moments. Full enterprise sales motion requires dedicated reps, complex demos, and multi-month negotiation cycles.
The hybrid PLG-plus-sales-assist model shows the strongest CAC efficiency among mid-market SaaS in 2026.
| Sales Motion | Average CAC | Best Practice CAC |
|---|---|---|
| Self-Serve PLG | $300 | $100 |
| PLG + Sales-Assist | $1,500 | $700 |
| Inside Sales (SMB-focused) | $2,800 | $1,300 |
| Field Sales (Enterprise) | $22,000 | $11,000 |
| Channel / Reseller | $1,800 | $800 |
Good CAC: Pure PLG CAC under $200 with product activation rates above 40% is best-in-class. Companies like Figma and Notion scaled their early user base on exactly this model.
Average CAC: Inside sales models at $2,000–$3,500 are standard for B2B SaaS targeting the 51–500 employee segment with ACVs between $5,000 and $20,000.
Bad CAC: Field sales CAC above $30,000 without enterprise ACV above $100,000 makes the unit economics nearly impossible to sustain, especially pre-Series C.
SaaS CAC Benchmarks by Annual Contract Value (ACV)
CAC scales with deal size. The higher the ACV, the more evaluation budget buyers allocate, the longer the sales cycle runs, and the more touchpoints you need to drive a decision. A product selling at $1,000 ACV competes on speed and simplicity. A product at $80,000 ACV competes on business case and relationships.
A reliable 2026 benchmark: CAC should not exceed 30–35% of first-year ACV for a healthy unit economics profile.
| ACV Range | Average CAC | Best Practice CAC |
|---|---|---|
| Under $1,000 | $250 | $100 |
| $1,000 – $5,000 | $1,200 | $550 |
| $5,000 – $15,000 | $4,000 | $2,000 |
| $15,000 – $50,000 | $10,000 | $5,500 |
| $50,000 – $100,000 | $22,000 | $12,000 |
| $100,000+ | $45,000 | $25,000 |
Good CAC: A $10,000 ACV product with $2,000 CAC puts your CAC:ACV ratio at 20%. That leaves healthy room for gross margin, customer success costs, and churn buffer.
Average CAC: A 30–35% CAC:ACV ratio is the industry standard for sales-led SaaS in the mid-market range. Most mature teams operate here.
Bad CAC: Any CAC exceeding 50% of first-year ACV warrants an immediate audit of your funnel stage conversion rates and channel ROI attribution.
SaaS CAC Benchmarks by Geographic Market
Geographic expansion changes your acquisition cost structure. Mature markets like the US and UK have established SaaS buyers, but higher CPCs, intense competition, and longer procurement timelines push CAC up. Emerging markets in Southeast Asia and Latin America offer lower acquisition costs but come with different conversion friction and longer trust-building timelines.
In 2026, Western European markets have seen a 15–20% CAC increase driven by GDPR compliance requirements. Stricter email targeting restrictions and reduced cookie-based retargeting have reduced paid channel precision across the region.
| Geographic Market | Average CAC | Best Practice CAC |
|---|---|---|
| United States | $4,500 | $2,200 |
| United Kingdom | $3,800 | $1,900 |
| Canada | $3,200 | $1,600 |
| Western Europe | $3,500 | $1,800 |
| Eastern Europe | $1,800 | $900 |
| India | $700 | $350 |
| Southeast Asia | $900 | $450 |
| Latin America | $1,100 | $550 |
| Australia / ANZ | $3,000 | $1,500 |
Good CAC: India and Southeast Asia deliver the lowest CAC globally for PLG or self-serve SaaS products with localized pricing tiers. These markets reward volume over deal size.
Average CAC: Western European CAC between $2,500 and $4,000 is expected given GDPR-related constraints and the relatively mature, risk-averse buyer culture.
Bad CAC: US CAC above $6,000 for SMB-focused SaaS with ACV below $5,000 is a direct signal that targeting is misaligned or the funnel has significant leakage between stages.
How to Improve SaaS CAC?
Benchmarks give you context. Improvement requires deliberate action on the right levers. Here are the moves that consistently produce meaningful CAC reductions without sacrificing pipeline quality.
Audit your channel mix ruthlessly
Most SaaS teams spread budget across too many channels too early. Identify your two or three highest-converting channels and concentrate spend there before expanding. Diversification before efficiency is a cash burn problem.
Invest in content and SEO compounding
Organic traffic reduces CAC every month as your content base grows. Teams that commit to content marketing in year one see 40–60% lower blended CAC by year three compared to teams that rely purely on paid channels.
Shorten your sales cycle
Every day a deal sits open adds carrying cost to your CAC calculation. Implement clear next-step agreements after every call. Use automation to close follow-up gaps. Build buyer-facing objection content that answers common blockers before the sales conversation starts.
Tighten your ICP and lead qualification
Acquiring a customer who churns in month three costs more than a higher-CAC customer with a three-year LTV. Score leads more aggressively, qualify out fast, and train your SDR team to disqualify pipeline that will never close or retain.
Use product activation signals for outreach timing
If your product offers a free trial or freemium tier, use in-product behavioral data to trigger sales outreach at peak intent moments. This reduces conversion friction and increases close rates without adding headcount.
Track CAC payback period alongside CAC itself
CAC in isolation misleads. A $5,000 CAC paid back in eight months is far healthier than a $2,000 CAC with a 24-month payback. Always pair CAC with payback period and LTV:CAC ratio to get the full picture of acquisition health.
Build into partner and community channels
Integration partners, technology alliances, and active buyer communities deliver warm, high-intent leads at a fraction of outbound cost. Community-led growth remains one of the most underinvested acquisition channels in B2B SaaS in 2026.
Conclusion
CAC isn’t a fixed number. What’s considered a good CAC depends on your pricing, growth stage, sales model, and customer retention. A high CAC can still be profitable if customers stay longer and generate more revenue over time.
Use these benchmarks as a reference point, not a target. Track your CAC alongside payback period, LTV, and conversion rates to understand what’s driving acquisition efficiency and identify opportunities for improvement.
SaaS CAC FAQs
What is the average CAC for SaaS companies?
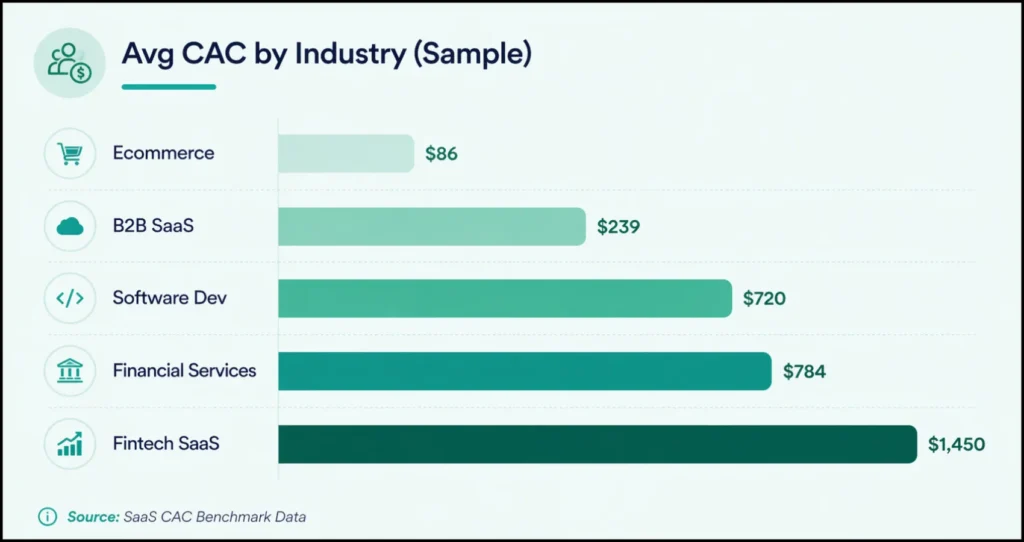
The average CAC for SaaS is typically $200–$400 for B2B, but it varies by industry. Ecommerce SaaS is lower, while fintech or enterprise SaaS can exceed $1,000. What matters most is whether your CAC is sustainable.
How does CAC differ between B2B and B2C SaaS?
B2B SaaS usually has higher CAC due to longer sales cycles and multiple decision-makers. B2C SaaS has lower CAC with faster, self-serve conversions. However, B2B often has higher customer value.
What is a good CAC payback period for SaaS?
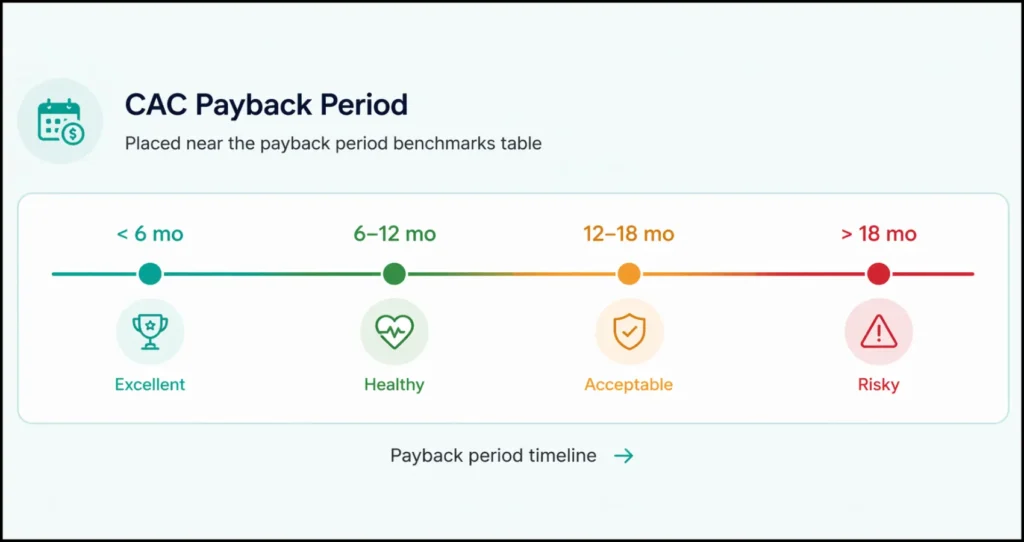
A good CAC payback period is 6–12 months. Up to 18 months is acceptable for many SaaS companies. Shorter payback means better cash flow.
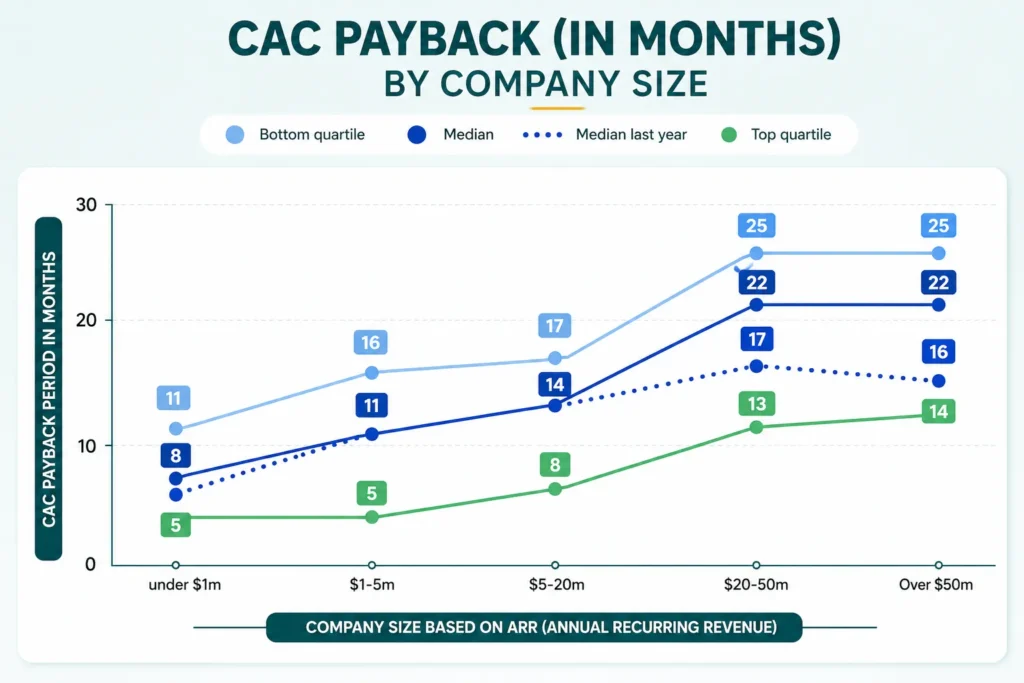
Why does CAC increase as SaaS companies scale?
CAC increases due to competition and channel saturation. Early low-cost channels become less effective over time. Scaling requires more expensive acquisition strategies.
Can CAC benchmarks vary by marketing channel in SaaS?
Yes, CAC varies by channel. SEO and referrals usually have lower CAC, while paid ads have higher costs. Each channel impacts CAC differently.

