
Every SaaS founder and marketing leader walks into 2026 with the same question: how much should we actually spend on marketing and where?
The honest answer is, it depends on your stage, your unit economics, and what kind of growth you’re funding. But “it depends” doesn’t help you build a plan.
By the end, you’ll know exactly what a healthy SaaS marketing budget looks like, how to allocate it across performance, content, PLG, lifecycle, and partnerships and how to optimize it quarterly so every dollar is tied to pipeline.
What Is a SaaS Marketing Budget?
A SaaS marketing budget is the total amount of money a software company commits to acquiring, activating, and expanding customers over a defined period, usually a fiscal year, broken down by quarter and month.
Unlike traditional marketing budgets, a SaaS marketing budget must account for the unique economics of subscription revenue.
This includes long payback periods, compounding customer lifetime value (LTV), churn that gradually erodes growth, and expansion revenue that often exceeds new customer acquisition.
Why SaaS Companies Need a Structured Budget
Many SaaS companies still increase budgets yearly without tying spend to growth outcomes. A structured SaaS marketing budget helps avoid wasted spend and improves scalability.
Here is why it matters:
- Connects marketing spend directly to pipeline, ARR, and customer acquisition
- Aligns budget with company stage and growth goals
- Prevents spreading budget too thin across too many channels
- Helps teams rebalance spending based on SaaS CAC benchmarks and performance trends
- Improves efficiency, CAC payback, and LTV: CAC ratios
SaaS companies with structured budgeting and regular reviews typically scale faster with better marketing efficiency.
A well-defined budget works best when paired with a strong SaaS marketing strategy, ensuring every marketing dollar contributes to sustainable growth and measurable business outcomes.
Looking for a SaaS marketing agency that builds performance systems to grow your ARR?
Explore SERP Forge’s SaaS Marketing Services →
What Are SaaS Marketing Budget Benchmarks for 2026?
Let’s start with the headline number, then dig into the variation that actually matters.
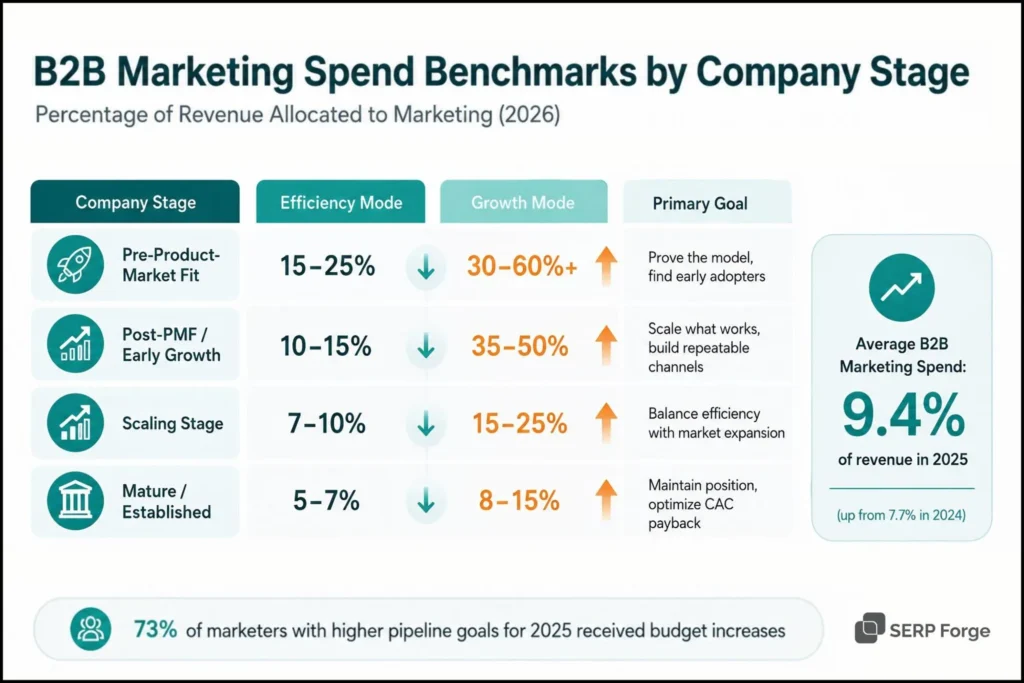
Gartner’s 2026 CMO Spend Survey puts total marketing budgets at 7.7% of company revenue across all sectors, down from the 11% peak in 2021 as companies tightened toward efficiency.
But that median masks enormous variation. Here’s what the 2026 data actually shows by stage and growth profile:
| Company Stage | Marketing Spend (% of Revenue) |
|---|---|
| Pre-product-market fit (Early-stage) | 30%–60% (sometimes 100%+ for VC-backed companies) |
| Growth Stage / Scaling | 15%–25% |
| Mature / Efficiency Mode | 5%–7% |
| High-growth Public SaaS | 10%–18% |
A few important nuances:
- Equity-backed vs. bootstrapped: Venture-backed SaaS companies spend roughly 100% more on marketing as a share of revenue than bootstrapped peers, reflecting their access to capital and pressure to capture market share.
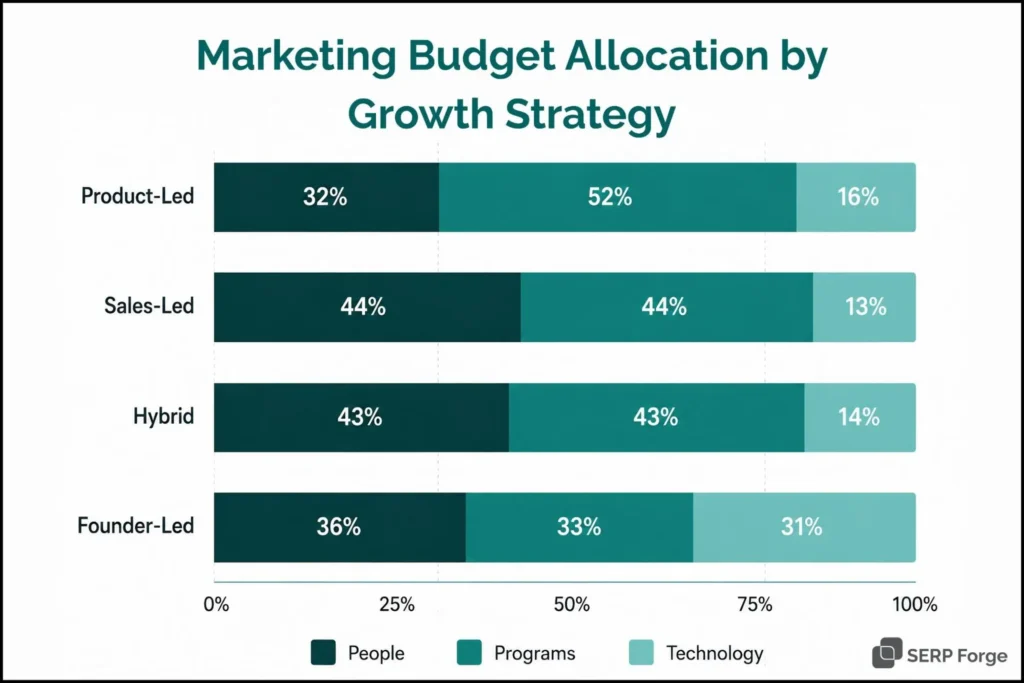
- PLG vs. SLG: Product-led growth firms tend to spend around 13% of revenue with heavier investment in product, content, and tooling, while sales-led companies average closer to 9% with more weight on demand generation and ABM.
- CAC reality check: The New CAC Ratio sales and marketing spend per $1 of new ARR now sits at $2.00, up 14% from $1.76 the year prior. Benchmarkit recommends keeping this ratio at $1.50 or below for companies with average contract values above $10K.
- Budget direction: Roughly 69–79% of marketers expect budget increases heading into 2026, but the winners aren’t the ones spending more they’re the ones allocating better. Knowing which SaaS marketing tools to invest in at each stage is a big part of allocating better.
If you remember one thing from this section, it’s this: don’t anchor on the 8% median. Anchor on your unit economics.
A company with a 4:1 LTV:CAC ratio and 8-month payback can afford to push toward 25%. A company with a 2:1 ratio and 20-month payback shouldn’t push past 7% until the unit economics improve.
SaaS Marketing Budget Breakdown by Stage
Stage is the single biggest determinant of a healthy SaaS marketing budget breakdown. Here’s how the numbers shift as you scale.
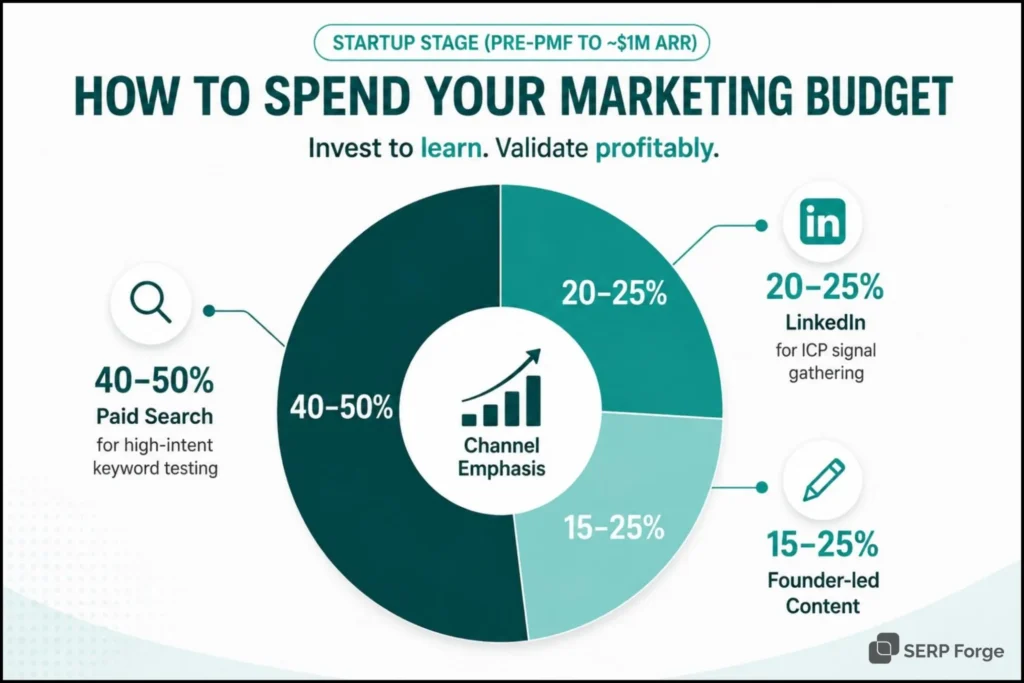
Startup Stage (Pre-PMF to ~$1M ARR)
At the startup stage, SaaS marketing budgets are primarily focused on learning which ICP converts, which channels perform best, and which messaging resonates with buyers.
The goal is not maximum scale yet, but validating repeatable customer acquisition and refining a sustainable go-to marketing strategy.
| Area | Typical Startup SaaS Approach |
|---|---|
| Marketing Spend | Typically 30%–60% of revenue, often higher for VC-backed startups. |
| Bootstrapped Budget Range | Usually capped around $5K–$15K per month until revenue growth becomes stable. |
| Paid Search Allocation | Approximately 40%–50% allocated toward testing high-intent keywords and acquisition channels. |
| LinkedIn Allocation | Roughly 20%–25% focused on ICP targeting, networking, and audience research. |
| Founder-Led Content | About 15%–25% dedicated to thought leadership and early-stage trust building. |
| Primary Goal | Validate profitable customer acquisition before increasing spend and scaling operations. |
| Key Metrics | Track Cost per Qualified Opportunity (CPQO) and time-to-first-paying-customer. |
One of the biggest mistakes at this stage is investing too heavily in SEO and brand-building before validating product-market fit and buyer intent.
SEO compounds over time, but only after SaaS companies clearly understand which keywords and problems their ICP actively searches for.
Growth Stage ($1M–$10M ARR)
This is the inflection point. You’ve found PMF, you know which channels work, and now you’re scaling what’s working while layering compounding engines.
- Spend range: 15–25% of revenue
- Channel emphasis: 30–40% paid (Google + LinkedIn), 20–25% content & SEO, 15–20% ABM, 10–15% events, 5–10% brand
- Goal: Hit aggressive growth targets while keeping CAC payback under 12 months and LTV:CAC above 3:1
- Key metric: New ARR per marketing dollar, channel-level CAC payback
At the growth stage, content and SEO finally earn their place as primary pipeline drivers. The compounding curve from organic search starts to flatten paid spend pressure and that’s how you protect margin as you scale.
Scale Stage ($10M+ ARR)
By scale stage, the goal shifts from growth-at-any-cost to efficient, durable expansion. Net revenue retention (NRR) and expansion revenue start carrying as much weight as new logo acquisition.
- Spend range: 8–15% of revenue (mature firms often 5–10%)
- Channel emphasis: 25–35% paid, 20–25% content/SEO, 15–20% ABM, 10–15% events, 5–10% brand
- Goal: Optimize CAC ratio, expand into new segments, defend market position
- Key metric: Blended CAC ratio, NRR, expansion ARR contribution
At this stage, retention and lifecycle marketing get serious budgets. With median NRR sitting around 101% and expansion ARR representing roughly 40% of new revenue at healthy SaaS companies, your existing customers become your primary growth engine.
SaaS Marketing Budget Allocation by Channel
Here’s where the SaaS marketing budget allocation conversation gets practical. Below are the channels that consistently earn a budget in 2026, with realistic allocation ranges and what each one is actually for.
Performance Marketing (15–25% of total budget)
Performance marketing is the fastest way for SaaS companies to generate predictable pipeline, but it is also the easiest place to overspend without healthy CAC and payback periods.
Most SaaS companies allocate 15–25% of their marketing budget to paid acquisition, though the ideal split depends on growth stage and sales motion.
| Channel / Tactic | Recommended Allocation | Expected ROI Timeline |
|---|---|---|
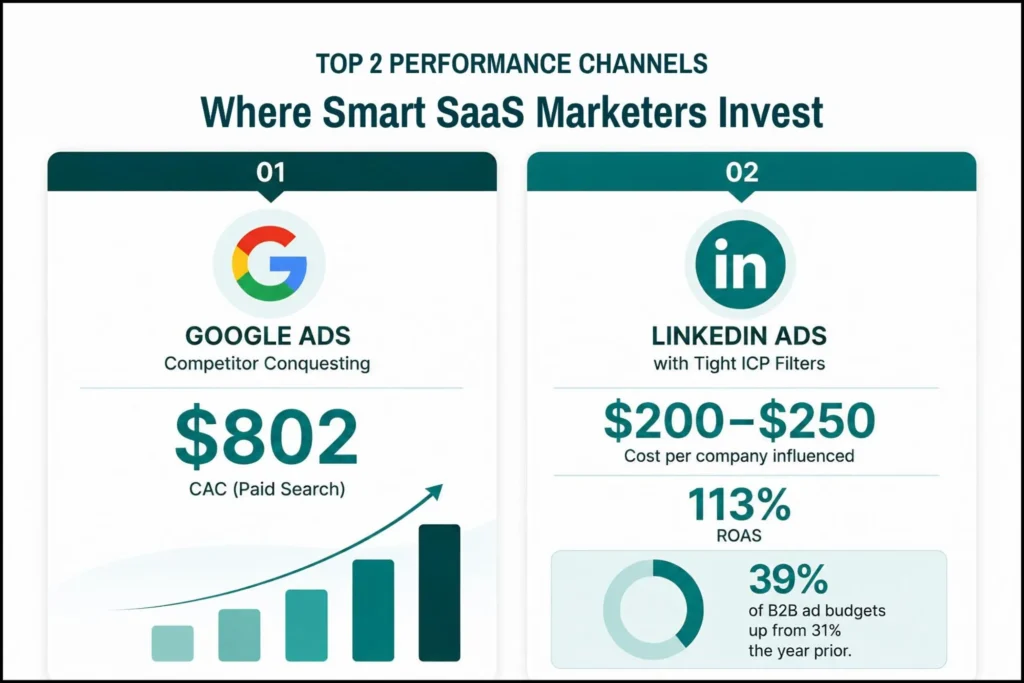
| Google Ads Competitor Campaigns | 25%–35% of paid advertising budget | 2–4 months |
| LinkedIn Ads | 30%–40% of paid advertising budget | 3–6 months |
| Retargeting Campaigns | 15%–20% of paid advertising budget | 1–3 months |
| Lookalike Audiences | 10%–15% of paid advertising budget | 2–5 months |
Early-stage SaaS companies typically keep paid acquisition closer to 10–15% until messaging, onboarding, and conversion rates stabilize. Growth-stage SaaS brands often increase paid spend once CAC efficiency becomes predictable.
LinkedIn now accounts for a growing share of B2B SaaS ad spend because of its strong targeting capabilities, especially for enterprise and account-based campaigns. However, scaling paid social too early without strong activation and retention metrics can quickly reduce marketing efficiency.
Content Marketing & SEO (20–30% of total budget)
SEO and content marketing generate the strongest long-term ROI in SaaS, but returns compound gradually. Most SaaS companies allocate 20–30% of total marketing budget here, with the split usually looking like:
| Investment Area | Recommended Share | Expected ROI Timeline |
|---|---|---|
| Bottom-of-Funnel Content | 40%–50% | 4–8 months |
| Backlink Acquisition | 25%–35% | 6–12 months |
| Technical SEO | 10%–15% | 3–6 months |
| Programmatic SEO & AEO | 10%–15% | 8–18 months |
Bottom-of-funnel pages like comparison, alternatives, integration, and pricing content usually deliver the fastest SEO-driven conversions.
Backlink acquisition should remain a major investment area in competitive SaaS niches. Underfunding backlinks often slows rankings even when content quality is strong.
New SaaS websites typically see meaningful SEO pipeline impact within 9–12 months, while established brands may achieve results faster due to existing authority.
Product-Led Growth (10–20% of total budget)
PLG-focused SaaS companies typically allocate 10–20% of their marketing budget toward activation, onboarding, and product-driven conversion systems.
| PLG Investment Area | Recommended Share | Expected ROI Timeline |
|---|---|---|
| Onboarding & Activation | 35%–40% | 2–5 months |
| Freemium and Free-Tool Funnels | 20%–30% | 4–8 months |
| Referral and Viral Loops | 15%–20% | 6–12 months |
| Conversion Experiments | 15%–20% | 2–4 months |
Early-stage PLG SaaS companies usually prioritize onboarding and activation improvements before scaling acquisition. Mature PLG businesses often shift more budget toward retention and expansion loops to improve LTV and reduce CAC dependence over time.
PLG firms also tend to invest more heavily in technical content, developer education, and product-focused growth infrastructure than traditional sales-led SaaS companies.
Email & Lifecycle Marketing (5–10% of total budget)
Email and lifecycle marketing consistently deliver the highest ROI in SaaS, yet many companies still underallocate budget here compared to paid acquisition.
Most SaaS brands spend only 5–10% of total marketing budget on lifecycle marketing despite it often generating the lowest CAC across all channels.
| Lifecycle Area | Recommended Share | Expected ROI Timeline |
|---|---|---|
| Trial Onboarding Sequences | 30%–40% | 1–3 months |
| Lead Nurturing Campaigns | 20%–25% | 2–4 months |
| Customer Expansion Campaigns | 20%–25% | 3–6 months |
| Win-back Automation | 10%–15% | 2–5 months |
| Newsletter & Retention | 10%–15% | Long-term |
The strongest returns usually come from onboarding and activation-focused email flows tied to product usage milestones.
For the full playbook on building these sequences, see our guide to SaaS email marketing.
A common SaaS budgeting mistake is overinvesting in acquisition while underfunding retention and expansion campaigns that improve LTV and overall marketing efficiency.
Partnerships & Affiliate Marketing (5–15% of total budget)
Partnerships and affiliate programs often become cost-efficient acquisition channels as paid CAC increases. Most SaaS companies allocate 5–15% of marketing budget here depending on their sales model and market maturity.
| Partnership Type | Recommended Share | Expected ROI Timeline |
|---|---|---|
| Affiliate Programs | 25%–35% | 2–4 months |
| Co-marketing Partnerships | 20%–25% | 3–6 months |
| Agency & Reseller Programs | 25%–35% | 4–9 months |
| Integration Partnerships | 15%–25% | 6–12 months |
PLG SaaS companies often prioritize integration partnerships because they double as distribution channels. Enterprise SaaS brands typically invest more heavily in agency and reseller partnerships that can generate larger deal sizes with lower outbound acquisition costs.
While partnerships usually scale slower than paid ads initially, they often produce stronger trust, lower CAC, and more sustainable pipeline growth over time.
How to Create a SaaS Marketing Budget
Building a SaaS marketing budget that actually drives growth comes down to a repeatable seven-step process. Here’s how to do it.
Step 1: Anchor to Your Unit Economics
Before you set a single number, calculate three metrics:
- Current LTV:CAC ratio (target: 3:1 or better)
- CAC payback period (target: under 12 months, best-in-class is 80–120 days)
- Net revenue retention (target: 100%+ for SMB SaaS, 110%+ for mid-market and enterprise)
A SaaS Metrics Calculator can help you calculate and benchmark these core metrics before setting your budget.
If your ratios are healthy, you can scale spend. If they’re not, optimize the SaaS marketing funnel before increasing the budget. More spend on a broken funnel just produces more expensive failures.
Step 2: Define Revenue and Pipeline Targets
Work backward from your ARR target. If you need $5M in new ARR and your average sales cycle pipeline-to-close ratio is 4:1, you need $20M in qualified pipeline.
Divide by your average deal size to get the number of opportunities you need, then by your historical conversion rate to get the number of MQLs required.
Multiply that MQL count by your blended cost-per-MQL, and you have a bottom-up budget number to validate against your top-down percentage benchmark.
Step 3: Pick a Total Spend Range
Use the stage benchmarks from earlier in this guide. Pick a percentage of revenue that matches your stage and growth ambition, and pressure-test it against the bottom-up number from Step 2. If they’re meaningfully different, the lower number is usually closer to reality.
Step 4: Allocate Across Channels
Apply the channel ranges from the breakdown above, but adjust based on your historical channel performance.
If LinkedIn produced 40% of pipeline last year at 60% of CAC, give it more this year. If a channel underperforms, cut it, don’t just trim it.
Step 5: Reserve a Testing Budget
Allocate 10–20% of total budget to experiments, new channels, new audiences, new creative formats, AI-driven workflows. Top-performing teams treat this as a strict line item with clear scale-or-kill criteria.
Step 6: Build in Quarterly Rebalancing
Lock in the annual envelope, but commit to reallocating 10–15% of the quarterly budget based on actual channel performance. The companies that beat their plans rebalance ruthlessly. The companies that miss plans defend last quarter’s allocation.
Step 7: Tie Every Dollar to a Metric
Every channel line should map to a specific KPI: pipeline generated, MQLs, qualified opportunities, new ARR, expansion ARR, or activation rate. Vanity metrics (impressions, followers, traffic without conversion) don’t earn a budget.
SaaS Budget Models You Can Use
Different stages and contexts call for different budgeting models. Here are the four that consistently work in B2B SaaS.
1. Percentage of Revenue Model
The simplest and most common model: allocate a fixed percentage of ARR (typically 8–25%) to marketing. Use 8–10% for mature efficiency mode, 15–20% for active growth, 20–40% for early stage chasing market share.
Here’s how the percentage-of-revenue budgeting model works in SaaS marketing:
- Strength: Easy to defend to finance and the board. Scales naturally with revenue.
- Weakness: It’s a backward-looking metric. It doesn’t tell you whether the spend is working, just whether it’s “normal.”
- Best for: Mature SaaS companies with stable unit economics and predictable growth.
2. Objective-Based Budgeting
Start with the goal say, $5M in new ARR and work backward through the funnel to figure out what spend it requires. Multiply MQL count by cost per MQL, add agency and tooling costs, and you have your number.
Here’s how the objective-based budgeting model works in SaaS marketing:
- Strength: Directly tied to revenue outcomes. Forces honest conversations about funnel conversion rates.
- Weakness: Only works if you have reliable historical conversion data.
- Best for: Growth-stage SaaS with mature funnel analytics and a clear pipeline target.
3. Competitive Parity Model
Set your budget based on what direct competitors are spending. Use tools like SimilarWeb, SpyFu, or Ahrefs to estimate competitor paid spend, content investment, and SEO footprint, then match or exceed strategically.
Here’s how the competitive parity budgeting model works in SaaS marketing:
- Strength: Useful in head-to-head categories where share of voice matters.
- Weakness: Assumes competitors are spending intelligently, which is often wrong. Easy to get into wasteful arms races.
- Best for: Crowded categories with two or three clear category leaders.
4. Zero-Based Budgeting (ZBB)
Build the budget from zero every cycle. Every line item must justify its existence based on expected ROI no automatic carryover from last year.
Here’s how the zero-based budgeting model works in SaaS marketing:
- Strength: Surfaces wasted spend. The classic ZBB story: a $40M B2B SaaS company finds events have grown 25% year-over-year while contribution stayed flat, MarTech includes 14 tools but only seven get used, and SEO is producing pipeline at half the CAC of paid but is underfunded because nobody asked.
- Weakness: Operationally heavy. Best run every 24–36 months, not every year.
- Best for: Any SaaS company that hasn’t seriously audited spend in 2+ years.
How to Optimize Your SaaS Marketing Budget?
A budget is a starting hypothesis, not a static plan. Here’s how to optimize through the year:
Run Quarterly Channel Reviews
Review spend, MQLs, ARR contribution, CAC, and payback period for every channel. Reduce investment in underperforming channels and scale the ones driving stronger ROI.
Track CAC by Channel
Do not rely only on blended CAC. SEO, email, and referrals often deliver better long-term efficiency than expensive paid channels.
Improve Attribution Tracking
Privacy updates and cookie changes have reduced attribution accuracy. Use channel-level ROAS testing and media mix analysis to improve decision-making.
Audit Marketing Tools Regularly
Many SaaS teams underuse their MarTech stack. Review tools annually and remove overlapping software to reduce unnecessary costs.
Invest More in Retention and Expansion
Lifecycle marketing, upselling, and customer expansion often improve profitability faster than focusing only on new customer acquisition.
Prioritize AEO and Structured SEO
As AI Overviews reduce traditional clicks, SaaS companies should invest in schema markup, structured data, and citation-focused content.
Set Budget Rebalance Triggers
Top SaaS companies adjust budgets quickly when CAC rises or channel performance declines instead of waiting for annual planning cycles.
Tracking SaaS marketing trends helps teams invest in the right channels before competitors.
SaaS Marketing Budget Examples
Here’s what real SaaS marketing budgets look like at different scales.
1. Slack (early days): Famously grew to a $1B valuation in two years without a CMO and without major paid campaigns. Limited marketing budget went almost entirely into product experience, customer feedback loops, and frictionless onboarding a textbook PLG budget where “marketing” spend was effectively product investment driving word-of-mouth.
2. Atlassian (public, ~$4.35B revenue): Spent approximately $877M on sales and marketing about 20% of revenue. A relatively lean ratio for high-growth public SaaS, reflecting strong PLG dynamics and organic distribution.
3. HubSpot (public, ~$2.17B revenue): Spent approximately $1.07B on sales and marketing roughly 49% of revenue. A textbook MLG (marketing-led growth) profile with heavy investment in content, inbound, conferences, and brand.
The lesson: there is no single “right” SaaS marketing budget. There’s only the budget that matches your stage, your motion, and your unit economics.
Conclusion
Building a SaaS marketing budget for 2026 isn’t about chasing the 8% median or copying what HubSpot does.
It’s about anchoring to your unit economics, picking a stage-appropriate spend range, allocating across the three or four channels that actually compound for your motion, and rebalancing quarterly as channels saturate and new ones emerge.
Use the benchmarks, breakdowns, and budget models in this guide as a starting framework then make the numbers yours. Build the plan, run it for 90 days, measure honestly, and rebalance.
Your SaaS marketing budget should be the most defensible document in your company. Make it earn that title.
SaaS Marketing Budget FAQs
1. What percentage of revenue should a SaaS company spend on marketing in 2026?
Most B2B SaaS companies spend 8–15% of ARR on marketing. Early-stage startups may spend 20–40%, while mature SaaS brands often stay between 5–7%.
2. How should I allocate my SaaS marketing budget across channels?
A common saas marketing budget allocation includes 20–30% for SEO and content, 15–25% for paid ads, 10–20% for product-led marketing, and 5–15% for retention and partnerships.
3. What is a healthy CAC payback period for SaaS in 2026?
Most SaaS companies aim for a CAC payback period under 12 months. High-performing SaaS brands often recover CAC within 3–6 months.
4. How should SaaS companies budget for SEO and content in 2026?
Many SaaS companies allocate 70–80% of SEO budgets toward content and authority building, while 20–30% goes toward schema, structured data, and AI search optimization.
5. Should bootstrapped SaaS companies follow the same benchmarks as funded SaaS companies?
No. Bootstrapped SaaS companies usually focus on profitable growth and lean budgets, while venture-backed SaaS brands spend more aggressively to scale faster.

