




Estimate your saas valuation using ARR, growth, retention, margin and churn. Our calculator shows what the company could be worth and why it received that ARR multiple.
Find out what your SaaS could be worth today.
This saas valuation calculator estimates your valuation, explains the ARR multiple and shows which metric could add the most value.
You will also see your valuation range, investor readiness and future value at a higher ARR.
[SAAS VALUATION CALCULATOR]
What Is a SaaS Valuation Calculator?
A SaaS valuation calculator is a modelling tool that estimates enterprise value from recurring revenue and operating metrics.
The starting calculation is:
SaaS Valuation = ARR × ARR Multiple
However, two companies with the same ARR can receive different multiples. That is why our calculator adjusts that multiple using ARR growth, NRR, gross margin and monthly logo churn.
For example, $2 million ARR at a 5x multiple produces a $10 million valuation. The same ARR at 8x produces $16 million.
The calculator explains that difference through its readiness score, benchmark comparison and improvement scenarios.
A saas business valuation calculator is useful during fundraising, board planning, acquisition discussions and annual reviews. The output is a modelled estimate rather than a transaction offer.
How Does Our SaaS Valuation Calculator Work?
Enter five company metrics and select Calculate Valuation. The calculator scores each metric against predefined thresholds.
It then assigns an ARR multiple and calculates a low, base and high valuation.
Key Inputs
Use figures from the latest closed reporting period:
| Input | What to Enter |
| Annual Recurring Revenue | Contracted recurring revenue expected across 12 months |
| ARR Growth Rate | Year-over-year percentage change in ARR |
| Net Revenue Retention | Existing customer revenue after expansion and losses |
| Gross Margin | Revenue remaining after direct delivery costs |
| Monthly Logo Churn | Percentage of customer accounts lost each month |
ARR should include recurring subscription revenue. Therefore, exclude setup fees, implementation, consulting and other one-time income.
ARR growth should compare matching periods. NRR should use the same customer cohort across the measurement period.
NRR = (Starting ARR + Expansion − Contraction − Churned ARR) ÷ Starting ARR × 100
Gross margin should include direct costs such as hosting and support delivery. Logo churn counts lost accounts, while revenue churn measures lost revenue.
Valuation Outputs
The results panel should display:
- Estimated valuation
- Low, base and high valuation range
- Investor readiness score
- Recommended ARR multiple
- Biggest value driver
- Confidence level
- Benchmark comparison
- Valuation improvement opportunities
- Exit scenario estimate
- Investor insight
The estimated valuation should remain the largest result.
For example:
Estimated Valuation: $12.5M
Recommended ARR Multiple: 7.2x
We show the calculation drivers beside the result. This includes the readiness score, benchmark comparison and biggest value driver.
Investor Insight
The investor insight should present one priority based on the largest modelled valuation opportunity.
For example:
NRR is below the internal benchmark. Raising it to 120% produces the largest projected valuation increase.
Use AI Investor Insight only when AI generates the recommendation. Otherwise, use Investor Insight.
What SaaS Valuation Formula Does the Calculator Use?
The calculator scores the inputs, assigns an arr multiple and models improvement scenarios.
Investor Readiness Score Formula
Each operating metric receives a score. The calculator then applies these weights:
- ARR growth: 35%
- NRR: 35%
- Gross margin: 20%
- Monthly logo churn: 10%
The saas valuation formula for readiness is:
Investor Readiness Score = Growth Score × 35% + NRR Score × 35% + Margin Score × 20% + Churn Score × 10%
Growth and NRR therefore control 70% of the score. The interface may label the result as Poor, Average, Good or Excellent.
These labels belong to the calculator’s internal framework. They do not represent a formal investment decision.
ARR Multiple Formula
An arr multiple is the number applied to ARR when estimating enterprise value.
The calculator starts with a 5x base multiple. It then applies these adjustments:
| Metric Threshold | Multiple Adjustment |
| ARR growth above 40% | +1x |
| ARR growth above 70% | +2x |
| NRR above 110% | +1x |
| NRR above 120% | +2x |
| Gross margin above 80% | +0.5x |
| Monthly logo churn below 2% | +0.5x |
For example, consider 55% growth, 112% NRR, 82% margin and 1.5% churn.
These inputs add 1x, 1x, 0.5x and 0.5x. Therefore, the recommended multiple becomes 8x.
The backend must define whether higher thresholds replace or stack with lower thresholds. Otherwise, the same input could produce different results.
Threshold Behaviour
Fixed thresholds can create sharp valuation changes.
For example, moving from 109% to 111% NRR can add 1x to the multiple. A small metric change may therefore create a large modelled increase.
The same effect appears around 40% growth, 70% growth, 80% margin and 2% churn. So, treat the result as a scenario estimate.
SaaS Valuation Formula
The main calculation is:
SaaS Valuation = ARR × Recommended ARR Multiple
For example:
$1.5M ARR × 8x = $12M
This approach supports saas company valuation because ARR provides the recurring revenue base. The multiple then reflects performance under the calculator’s rules.
Valuation Range Formula
The range uses a two-point spread:
Low Valuation = ARR × (Multiple − 2)
Base Valuation = ARR × Multiple
High Valuation = ARR × (Multiple + 2)
For example:
| Valuation Case | Calculation | Result |
| Low | $1.5M × 6x | $9M |
| Base | $1.5M × 8x | $12M |
| High | $1.5M × 10x | $15M |
The range shows sensitivity to the multiple. It does not represent buyer offers.
Which Metrics Have the Biggest Impact on SaaS Valuation?
ARR growth and NRR carry the highest weights. They also create the largest multiple adjustments.
ARR Growth and NRR
ARR growth is the annual increase in recurring revenue:
ARR Growth = (Current ARR − Previous ARR) ÷ Previous ARR × 100
The calculator adds 1x above 40% growth and 2x above 70%.
NRR is the revenue retained from an existing customer cohort. An NRR above 100% means expansion exceeds contraction and churn.
For context:
- 95% NRR means the cohort lost 5% of revenue.
- 105% NRR means the cohort expanded by 5%.
- 125% NRR matches the internal benchmark.
The calculator adds 1x above 110% NRR and 2x above 120%. Therefore, NRR affects both readiness and valuation.
Gross Margin and Logo Churn
Gross margin is the share of revenue remaining after direct delivery costs:
Gross Margin = (Revenue − Cost of Revenue) ÷ Revenue × 100
The calculator awards its highest margin score above 80%. It also adds 0.5x above that threshold.
Monthly logo churn is the percentage of customer accounts lost during one month:
Monthly Logo Churn = Lost Customers ÷ Starting Customers × 100
The calculator uses 1% as its internal benchmark. Churn below 2% adds 0.5x to the multiple.
Biggest Value Driver
The calculator tests four scenarios:
- Increase NRR by 10 percentage points
- Increase ARR growth by 20 percentage points
- Increase gross margin by 5 percentage points
- Reduce monthly logo churn by 1 percentage point
It recalculates valuation for each scenario:
| Improvement Scenario | New Valuation | Estimated Increase |
| Improve NRR to 120% | $18.1M | +$5.6M |
| Increase ARR growth to 70% | $16.2M | +$3.7M |
| Improve gross margin by 5% | $13.7M | +$1.2M |
| Reduce churn by 1% | $13.4M | +$900K |
The largest increase becomes the biggest value driver. However, the ranking measures model sensitivity rather than implementation difficulty.
The Rule of 40
The rule of 40 saas framework compares growth with profitability:
Revenue Growth Rate + Profit Margin = Rule of 40 Score
For example, 55% growth and a 5% profit margin produce 60%.
However, this calculator does not collect profit margin. Therefore, the Rule of 40 should remain supporting content.
How Should You Read Your SaaS Valuation Result?
Start with the estimated valuation and recommended multiple. Then review the range, readiness score, benchmark comparison and confidence level.
Investor Readiness Score
The readiness score combines four metrics into one number. However, two companies can receive the same score through different combinations.
One may have high growth and weak retention. Another may have slower growth and higher NRR.
So, review the component scores before relying on the label.
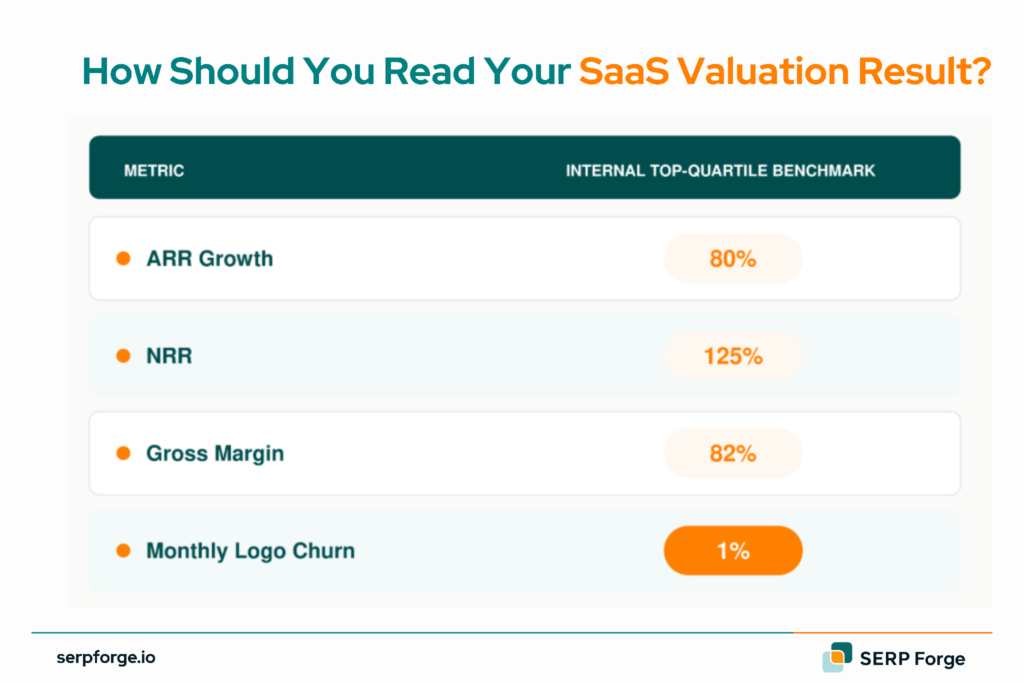
The benchmark panel uses these internal saas valuation benchmarks:
| Metric | Internal Top-Quartile Benchmark |
| ARR Growth | 80% |
| NRR | 125% |
| Gross Margin | 82% |
| Monthly Logo Churn | 1% |
The dataset should define company stage, ARR band, customer segment, reporting period and sample size.
Confidence Level
The confidence level should reflect data quality, metric consistency and benchmark coverage.
However, the backend needs exact scoring rules before showing a precise percentage. An 86% confidence result must come from a reproducible calculation.
Where Can You Increase Your SaaS Valuation?
Our improvement scenarios recalculate the valuation after changing growth, NRR, gross margin or churn.
It should also explain which threshold changed.
For example:
Reaching 120% NRR moves the company into the next NRR scoring band.
This makes the recommendation auditable. The investor insight should then connect the highest-ranked scenario with one operating investigation.
How Does Exit Scenario Modelling Work?
The exit scenario calculator estimates value at a target ARR:
Future Valuation = Target ARR × Current Recommended Multiple
For example:
$5M Target ARR × 8.4x = $42M Expected Future Valuation
The model keeps the current multiple unchanged. However, growth, retention, margins and market multiples may change before ARR reaches that target.
So, use the result to test ARR sensitivity rather than forecast a transaction price.
What Should You Do After Calculating Your SaaS Valuation?
Review the biggest value driver and verify the data behind it.
Check whether the projected gain comes from crossing a scoring threshold. Then weigh that gain against the cost and effort required.
Recalculate after each reporting period using the same metric definitions.
Need a closer review? Get a SaaS valuation assessment based on your metrics and growth priorities.
Review My SaaS Valuation
FAQs
How Do You Calculate SaaS Valuation?
A saas valuation is calculated by multiplying ARR by an ARR multiple. This calculator adjusts the multiple using growth, NRR, gross margin and logo churn.
What Is an ARR Multiple in SaaS Valuation?
An ARR multiple is the ratio between enterprise value and annual recurring revenue.
For example, a 7x multiple values $1 million ARR at $7 million. The calculator raises or lowers the multiple when key operating metrics cross its defined thresholds.
What Metrics Increase SaaS Valuation?
ARR growth, NRR, gross margin and monthly logo churn affect this calculator’s multiple. However, each metric must cross a defined threshold first.
How Does NRR Affect SaaS Valuation?
NRR shows how revenue from existing customers changes after expansion, contraction and churn.
The calculator increases the ARR multiple when NRR moves above 110% and again above 120%. Because NRR also carries 35% of the readiness score, it can affect several outputs at once.
How Can a SaaS Founder Improve Company Valuation?
Use the improvement scenarios to find the largest modelled increase. Then investigate the operating drivers behind that metric.