




What Is a SaaS LTV Calculator?
A SaaS LTV calculator is a tool that estimates the gross profit one customer may generate before leaving.
Our calculator returns:
- Customer lifetime value
- Expected customer lifetime
- Monthly gross profit
- LTV:CAC ratio
- CAC payback period
- Potential LTV increase from lower churn
- Growth efficiency score
- Churn impact simulation
- Biggest improvement opportunity
A basic customer lifetime value calculator often stops at one LTV figure. Our tool connects that result with acquisition efficiency, retention risk and the next metric worth improving.
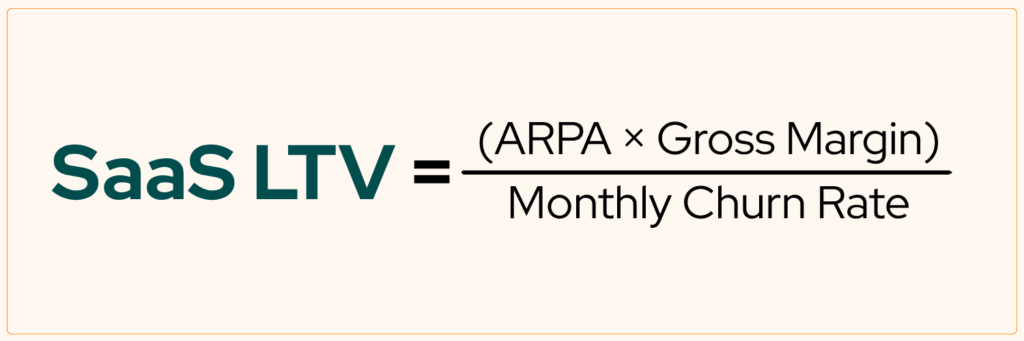
What SaaS LTV Formula Does Our Calculator Use?
The calculator first converts percentages into decimals. For example, 80% gross margin becomes 0.80, while 2% monthly churn becomes 0.02.
It then calculates monthly gross profit, expected customer lifetime and LTV.
Step 1: Convert Percentages
The calculator converts percentage inputs into decimals before using them in the formulas.
80% = 0.80
2% = 0.02
Step 2: Calculate Monthly Gross Profit
Monthly Gross Profit = ARPA × Gross Margin
With $500 ARPA and an 80% gross margin:
$500 × 0.80 = $400
Step 3: Calculate Customer Lifetime
Customer Lifetime = 1 ÷ Monthly Churn Rate
At 2% monthly churn:
1 ÷ 0.02 = 50 months
This formula assumes churn remains constant.
Step 4: Calculate SaaS LTV
LTV = Monthly Gross Profit × Customer Lifetime
The equivalent formula is:
LTV = ARPA × Gross Margin ÷ Monthly Churn Rate
Using the calculator example:
$500 × 0.80 ÷ 0.02 = $20,000
Step 5: Calculate LTV:CAC Ratio
LTV:CAC Ratio = LTV ÷ CAC
With $20,000 LTV and $4,000 CAC:
$20,000 ÷ $4,000 = 5.0x
Step 6: Calculate CAC Payback
CAC Payback = CAC ÷ Monthly Gross Profit
Using the same figures:
$4,000 ÷ $400 = 10 months
Step 7: Calculate the Potential LTV Increase From Lower Churn
The calculator reduces the entered churn rate by 25% and recalculates LTV.
Improved Churn = Current Churn × 75%
With 2% current churn:
2% × 75% = 1.5%
The calculator then compares the two results:
Potential LTV Increase = Improved LTV − Current LTV
Using the same example:
$26,667 − $20,000 = $6,667
This shows the additional lifetime value available per customer when churn falls by 25%.
How Does Our SaaS LTV Calculator Work?
Enter ARPA, gross margin, monthly churn and optional CAC. Then select Calculate LTV.
Key Inputs
Use figures from the same reporting period:
| Input | What to Enter |
| Average Revenue Per Account | Average monthly recurring revenue from one account |
| Gross Margin | Revenue retained after direct delivery costs |
| Monthly Churn Rate | Percentage of customer accounts lost each month |
| Customer Acquisition Cost | Average sales and marketing cost per new customer |
Exclude setup fees and one-time services from ARPA. Include direct delivery costs in gross margin and relevant sales and marketing spend in CAC.
LTV and Payback Outputs
The results panel displays customer lifetime value as the main result. It then shows customer lifetime, monthly gross profit, LTV:CAC, CAC payback and potential LTV increase.
LTV and CAC payback only appear when CAC is entered. The Growth Efficiency Score also requires CAC because the LTV score contributes 40% of the final result.
Growth Efficiency Insight
The growth efficiency score combines three metrics:
- LTV:CAC ratio at 40%
- Gross margin at 30%
- Monthly churn at 30%
The calculator grades each metric using predefined bands:
| Metric | Performance Band | Score |
| LTV:CAC | Below 1x | 20 |
| LTV:CAC | 1x to below 2x | 40 |
| LTV:CAC | 2x to below 3x | 60 |
| LTV:CAC | 3x to below 5x | 80 |
| LTV:CAC | 5x or higher | 100 |
| Gross margin | Below 50% | 20 |
| Gross margin | 50% to below 70% | 60 |
| Gross margin | 70% to below 80% | 80 |
| Gross margin | 80% or higher | 100 |
| Monthly churn | 5% or higher | 20 |
| Monthly churn | 3% to below 5% | 50 |
| Monthly churn | 2% to below 3% | 75 |
| Monthly churn | 1% to below 2% | 90 |
| Monthly churn | Below 1% | 100 |
Growth Efficiency Score = LTV:CAC Score × 40% + Gross Margin Score × 30% + Churn Score × 30%
The final result appears on a scale of 0 to 100 with a Poor, Average, Healthy, or Excellent rating.
Which Metrics Have the Biggest Impact on SaaS LTV?
ARPA and gross margin determine how much gross profit a customer produces each month. Churn determines how long that profit continues.
CAC does not change LTV itself. It changes whether the resulting customer value supports your acquisition spending.
ARPA and Gross Margin
A 10% increase in ARPA raises LTV by 10% when margin and churn remain unchanged.
Gross margin works in the same way. Moving from 75% to 80% increases monthly gross profit and LTV proportionally.
However, price increases can affect conversion or churn. Margin improvements may come from lower hosting, support, or infrastructure costs.
Monthly Churn Rate
Churn has a larger effect because customer lifetime equals one divided by churn.
At 2% monthly churn, customer lifetime is 50 months. At 1% churn, it becomes 100 months.
So, halving churn doubles modelled LTV when ARPA and margin stay unchanged.
Customer Acquisition Cost
CAC determines the return and payback attached to each customer.
A customer worth $20,000 may support a $4,000 CAC. The same LTV may not support a $15,000 CAC.
That is why customer lifetime value SaaS analysis should include both the LTV:CAC ratio and payback period.
How Should You Read Your SaaS LTV Result?
Review LTV alongside customer lifetime, monthly gross profit, acquisition efficiency and churn impact. Each output explains a different part of the result.
Customer Lifetime Value and Customer Lifetime
LTV shows expected gross profit per customer, while customer lifetime shows the retention assumption behind it. Review very low churn inputs carefully because small errors can inflate LTV.
Monthly Gross Profit
Monthly gross profit shows customer contribution before acquisition and operating expenses. It also determines CAC payback.
LTV:CAC Ratio
Use these internal ranges to interpret the result:
| LTV:CAC Ratio | Calculator Rating |
| Below 1x | Poor |
| 1x to 2x | Average |
| 2x to 3x | Improving |
| 3x to 5x | Healthy |
| 5x or higher | Excellent |
A higher ratio gives the business more room to fund acquisition. It can also suggest that the company is spending too cautiously.
CAC Payback Period
The calculator uses 12 months as its target.
A shorter payback returns acquisition cash sooner. A longer payback increases the capital needed to keep growing.
Compare payback by channel and customer segment. A blended figure can hide an expensive sales motion.
Growth Efficiency Score
The growth efficiency score summarises LTV:CAC, margin and churn.
Use it as a diagnostic measure. Then check which input raised or lowered the final score.
Benchmarks for LTV:CAC and Payback
These ranges help place the result in context:
| Metric | Internal Reference |
|---|---|
| CAC payback below 12 months | Faster cash recovery |
| CAC payback above 12 months | More capital tied up in growth |
Use the LTV:CAC rating table above alongside these payback references. Customer segment, sales cycle and contract length can change what is acceptable.
How Much Customer Value Could You Recover by Reducing Churn?
The churn simulator shows how a retention change affects customer lifetime value.
It keeps ARPA and gross margin unchanged. So, the difference comes entirely from the new churn assumption.
Potential LTV Increase
The $6,667 increase applies to one customer under the calculator assumptions. It does not represent company-wide recovered revenue.
Churn Impact Simulator
The default simulator reduces churn by 25%.
For example:
- Current churn: 2%
- Improved churn: 1.5%
- Current LTV: $20,000
- New LTV: $26,667
- Increase: $6,667
Improved Churn = 2% × 75% = 1.5%
Reducing churn by 25% increases the modelled LTV by about 33%.
Where Can You Improve SaaS LTV First?
Our calculator compares three standard scenarios:
- Reduce churn by 25%
- Increase ARPA by 10%
- Increase gross margin by five percentage points
It recalculates LTV for each scenario and ranks the outcome.
Reduce Churn Rate
Review churn by plan, segment, cohort and acquisition channel. Separate voluntary cancellations from failed payments. Each source needs a different fix.
Improve Gross Margin
Break direct costs into hosting, support, infrastructure and service delivery. Then identify which cost rises fastest as customer usage grows.
Increase ARPA
Review upgrades, add-ons, pricing tiers and usage limits. An ARPA increase is more durable when it follows added usage or customer value.
Biggest Opportunity Analysis
The biggest opportunity card shows the change with the highest modelled LTV increase. It displays the current LTV, projected LTV, dollar increase, percentage increase and input change.
What Should You Do After Calculating SaaS LTV?
Check whether the inputs represent one consistent customer segment. Average churn can hide large differences between enterprise, SMB and self-service customers.
Then compare the biggest opportunity with real cohort data. Review LTV:CAC and payback by acquisition channel before increasing spend.
Need a deeper review of your SaaS unit economics? We can assess LTV, CAC, churn and payback by customer segment.
Review My SaaS Unit Economics
FAQs
How Do You Calculate LTV for SaaS?
Use this formula: LTV = ARPA × Gross Margin ÷ Monthly Churn Rate
For example, $500 ARPA at an 80% margin produces $400 monthly gross profit. At 2% churn, the estimated lifetime is 50 months, giving a $20,000 LTV.
What Is a Good LTV Ratio for SaaS?
An LTV:CAC ratio of 3x or more is a common operating reference. Read it with CAC payback because a good lifetime return can still take too long to recover.
How Does Churn Affect SaaS LTV?
Churn determines the expected length of the customer relationship.
At 2% monthly churn, the modelled lifetime is 50 months. Reducing churn to 1% increases it to 100 months and doubles LTV.
What Is CAC Payback Period in SaaS?
CAC payback is the time required to recover acquisition costs through monthly gross profit. For example, a $4,000 CAC and $400 monthly gross profit produce a 10-month payback period.
How Can a SaaS Company Improve LTV?
Reduce churn, increase ARPA, or improve gross margin. The best choice depends on whether the current problem comes from retention, pricing, or delivery costs.
Our calculator tests all three changes and identifies the one with the largest modelled impact.