




What Is ROAS?
ROAS meaning is the return on ad spend. It measures how much revenue your ads generate for every dollar you spend on them.
Spend $1,000, generate $5,000 in sales: your ROAS is 5:1.
Every platform reports it differently. Google shows ROAS as a percentage. Meta shows it as a multiplier. This return on ad spend calculator standardises both so you can compare channels without converting numbers manually.
One thing ROAS does not tell you: whether you are actually profitable. A 6:1 ROAS on a 15% margin product can still be a loss after fulfilment costs and platform fees. Always read ROAS alongside your gross margin.
How to Calculate ROAS
The formula is simple. What trips most teams up is knowing which revenue number to use and how to read the result accurately.
ROAS Formula
ROAS = Total Ad Revenue /Total Ad Spend
As a percentage: (Total Ad Revenue/Total Ad Spend) x 100
Example: $2,000 ad spend, $14,000 in tracked revenue.
ROAS = 14,000 /2,000 = 7:1 or 700%
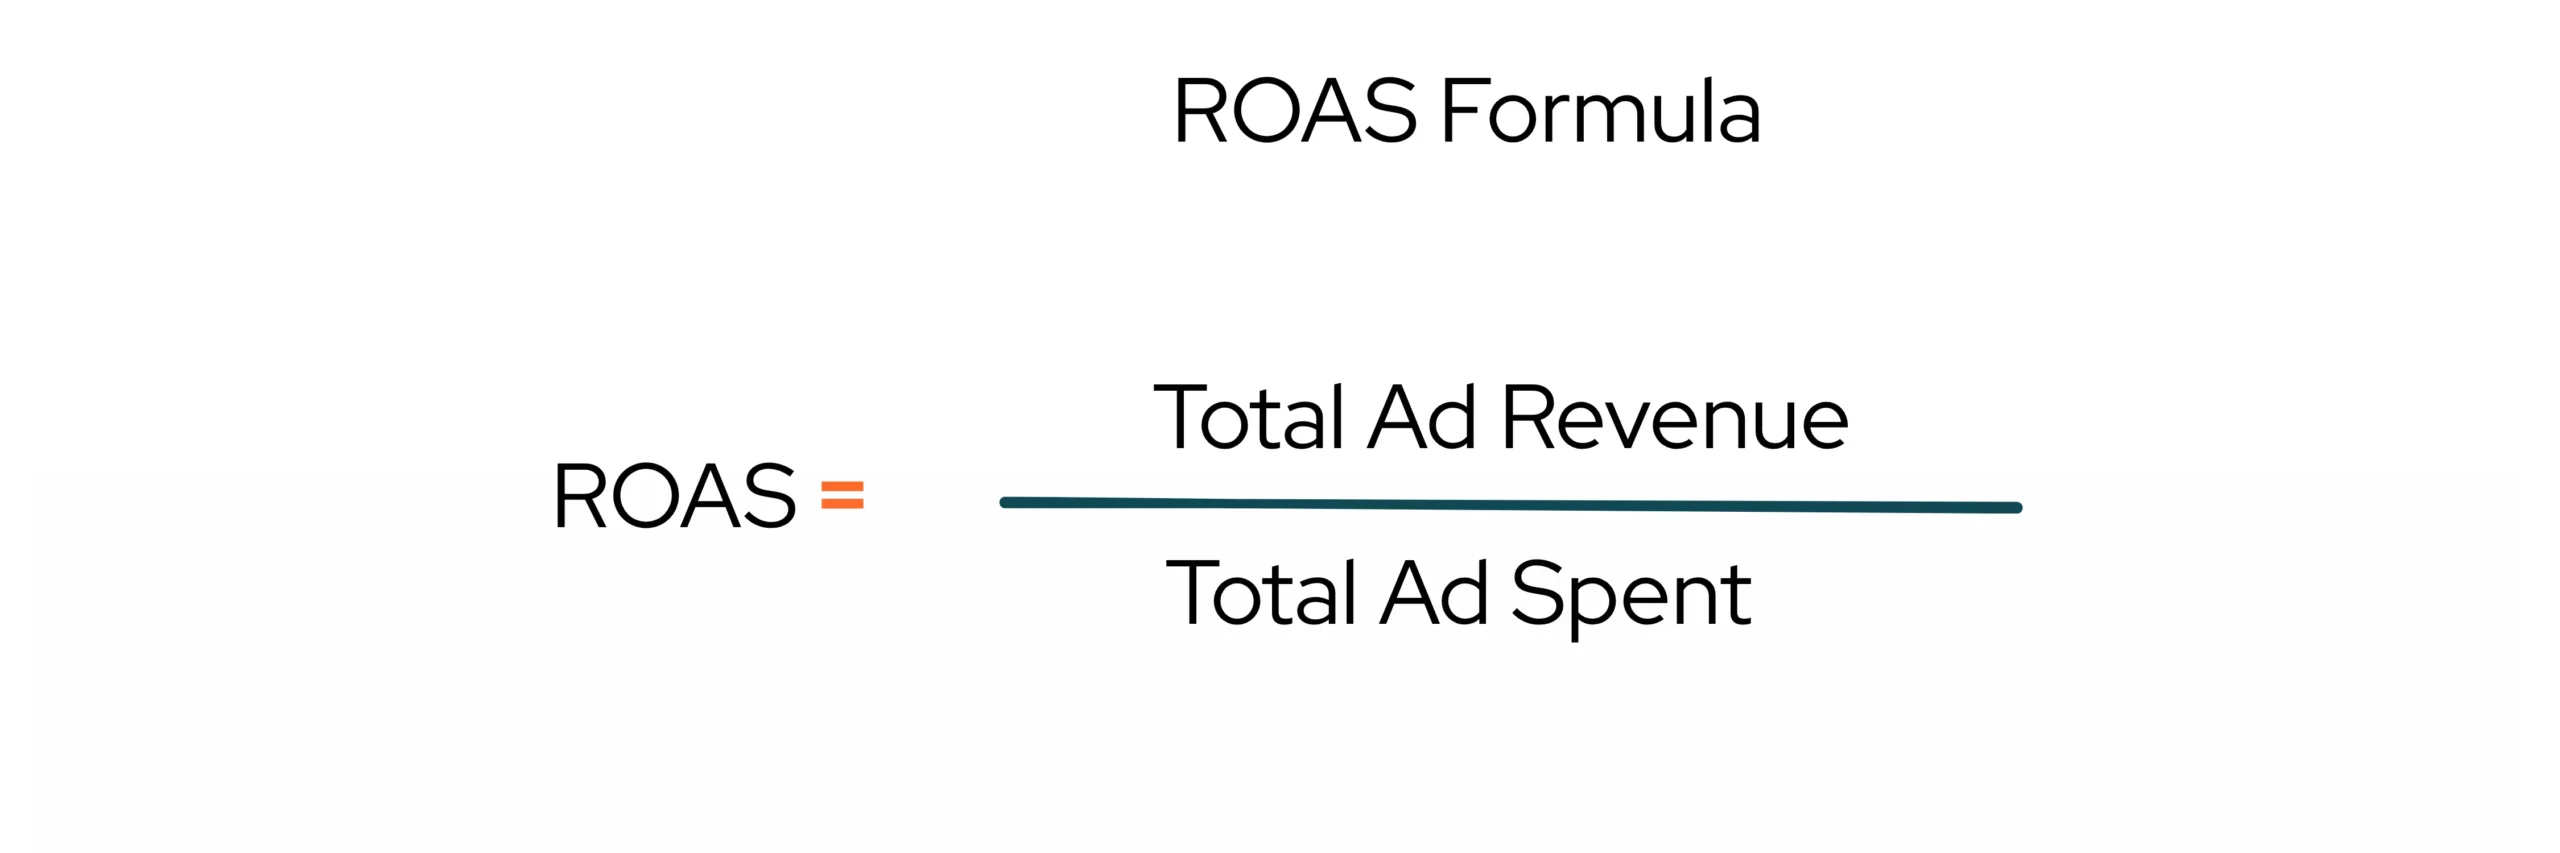
Two things to get right before calculating:
- Use only revenue directly attributed to paid spend. Including organic or direct revenue inflates ROAS and leads to bad decisions.
- Match your tracking window to your actual sales cycle. If your product typically sells within 3 days of an ad click, use a 7-day attribution window, not 28. A wider window pulls in sales that happened for other reasons and makes weak campaigns look effective.
ROAS vs ROI
ROAS measures revenue per ad dollar. ROI measures profit after all costs. The table shows the difference:
| ROAS | ROI | |
| Measures | Revenue per ad dollar | Profit after all costs |
| Scope | Ad channel only | Full business investment |
| Best for | Campaign decisions | Profitability decisions |
A 4:1 ROAS with a 25% margin, $20 shipping costs, and a 15% return rate is a loss. ROAS said scale. The full picture said stop. Use ROAS to optimise campaigns. Use ROI to decide if the business supports scaling.
ROAS vs ACoS
ACoS (Advertising Cost of Sales) is Amazon’s version of the same metric, flipped.
- ROAS = Revenue /Ad Spend
- ACoS = Ad Spend /Revenue
$500 spend, $2,000 revenue: ROAS = 400%, ACoS = 25%. Same campaign, opposite lens. Track ACoS on Amazon, ROAS everywhere else. Never mix them in the same report.
How to Use the ROAS Calculator
Enter two values on the left panel and hit Calculate ROAS. The results panel on the right updates instantly. Here is what goes in each field:
| Input | What to Enter |
| Total Revenue Generated ($) | Total revenue attributed to the campaign |
| Total Ad Spend ($) | Total amount spent on ads |
Once you hit Calculate ROAS, the results panel shows two outputs:
- Return on Ad Spend (ROAS) displayed as a multiplier, showing exactly how much revenue you earned for every $1 spent
- Formula showing the exact calculation used: ROAS = Total Revenue Generated ÷ Total Ad Spend
All values are used only for calculation and are not stored.
Three ways to use the result:
- Compare channels separately: Run the calculator for each platform individually. A blended 5:1 can hide a Google result of 9:1 and a Meta result of 1.8:1. Those two need completely different responses.
- Set a scaling floor: Decide your minimum ROAS before increasing budget on any campaign. If it has not cleared that floor in 30 days with enough spend to be meaningful, it does not get more money.
- Find your breakeven: Use the margin table in the next section to find the exact ROAS below which every sale loses money. That is your hard stop, not the generic 4:1 benchmark.
What Is a Good ROAS?
4:1 is the floor, not a target. What good looks like depends on your platform, margin, and funnel stage.
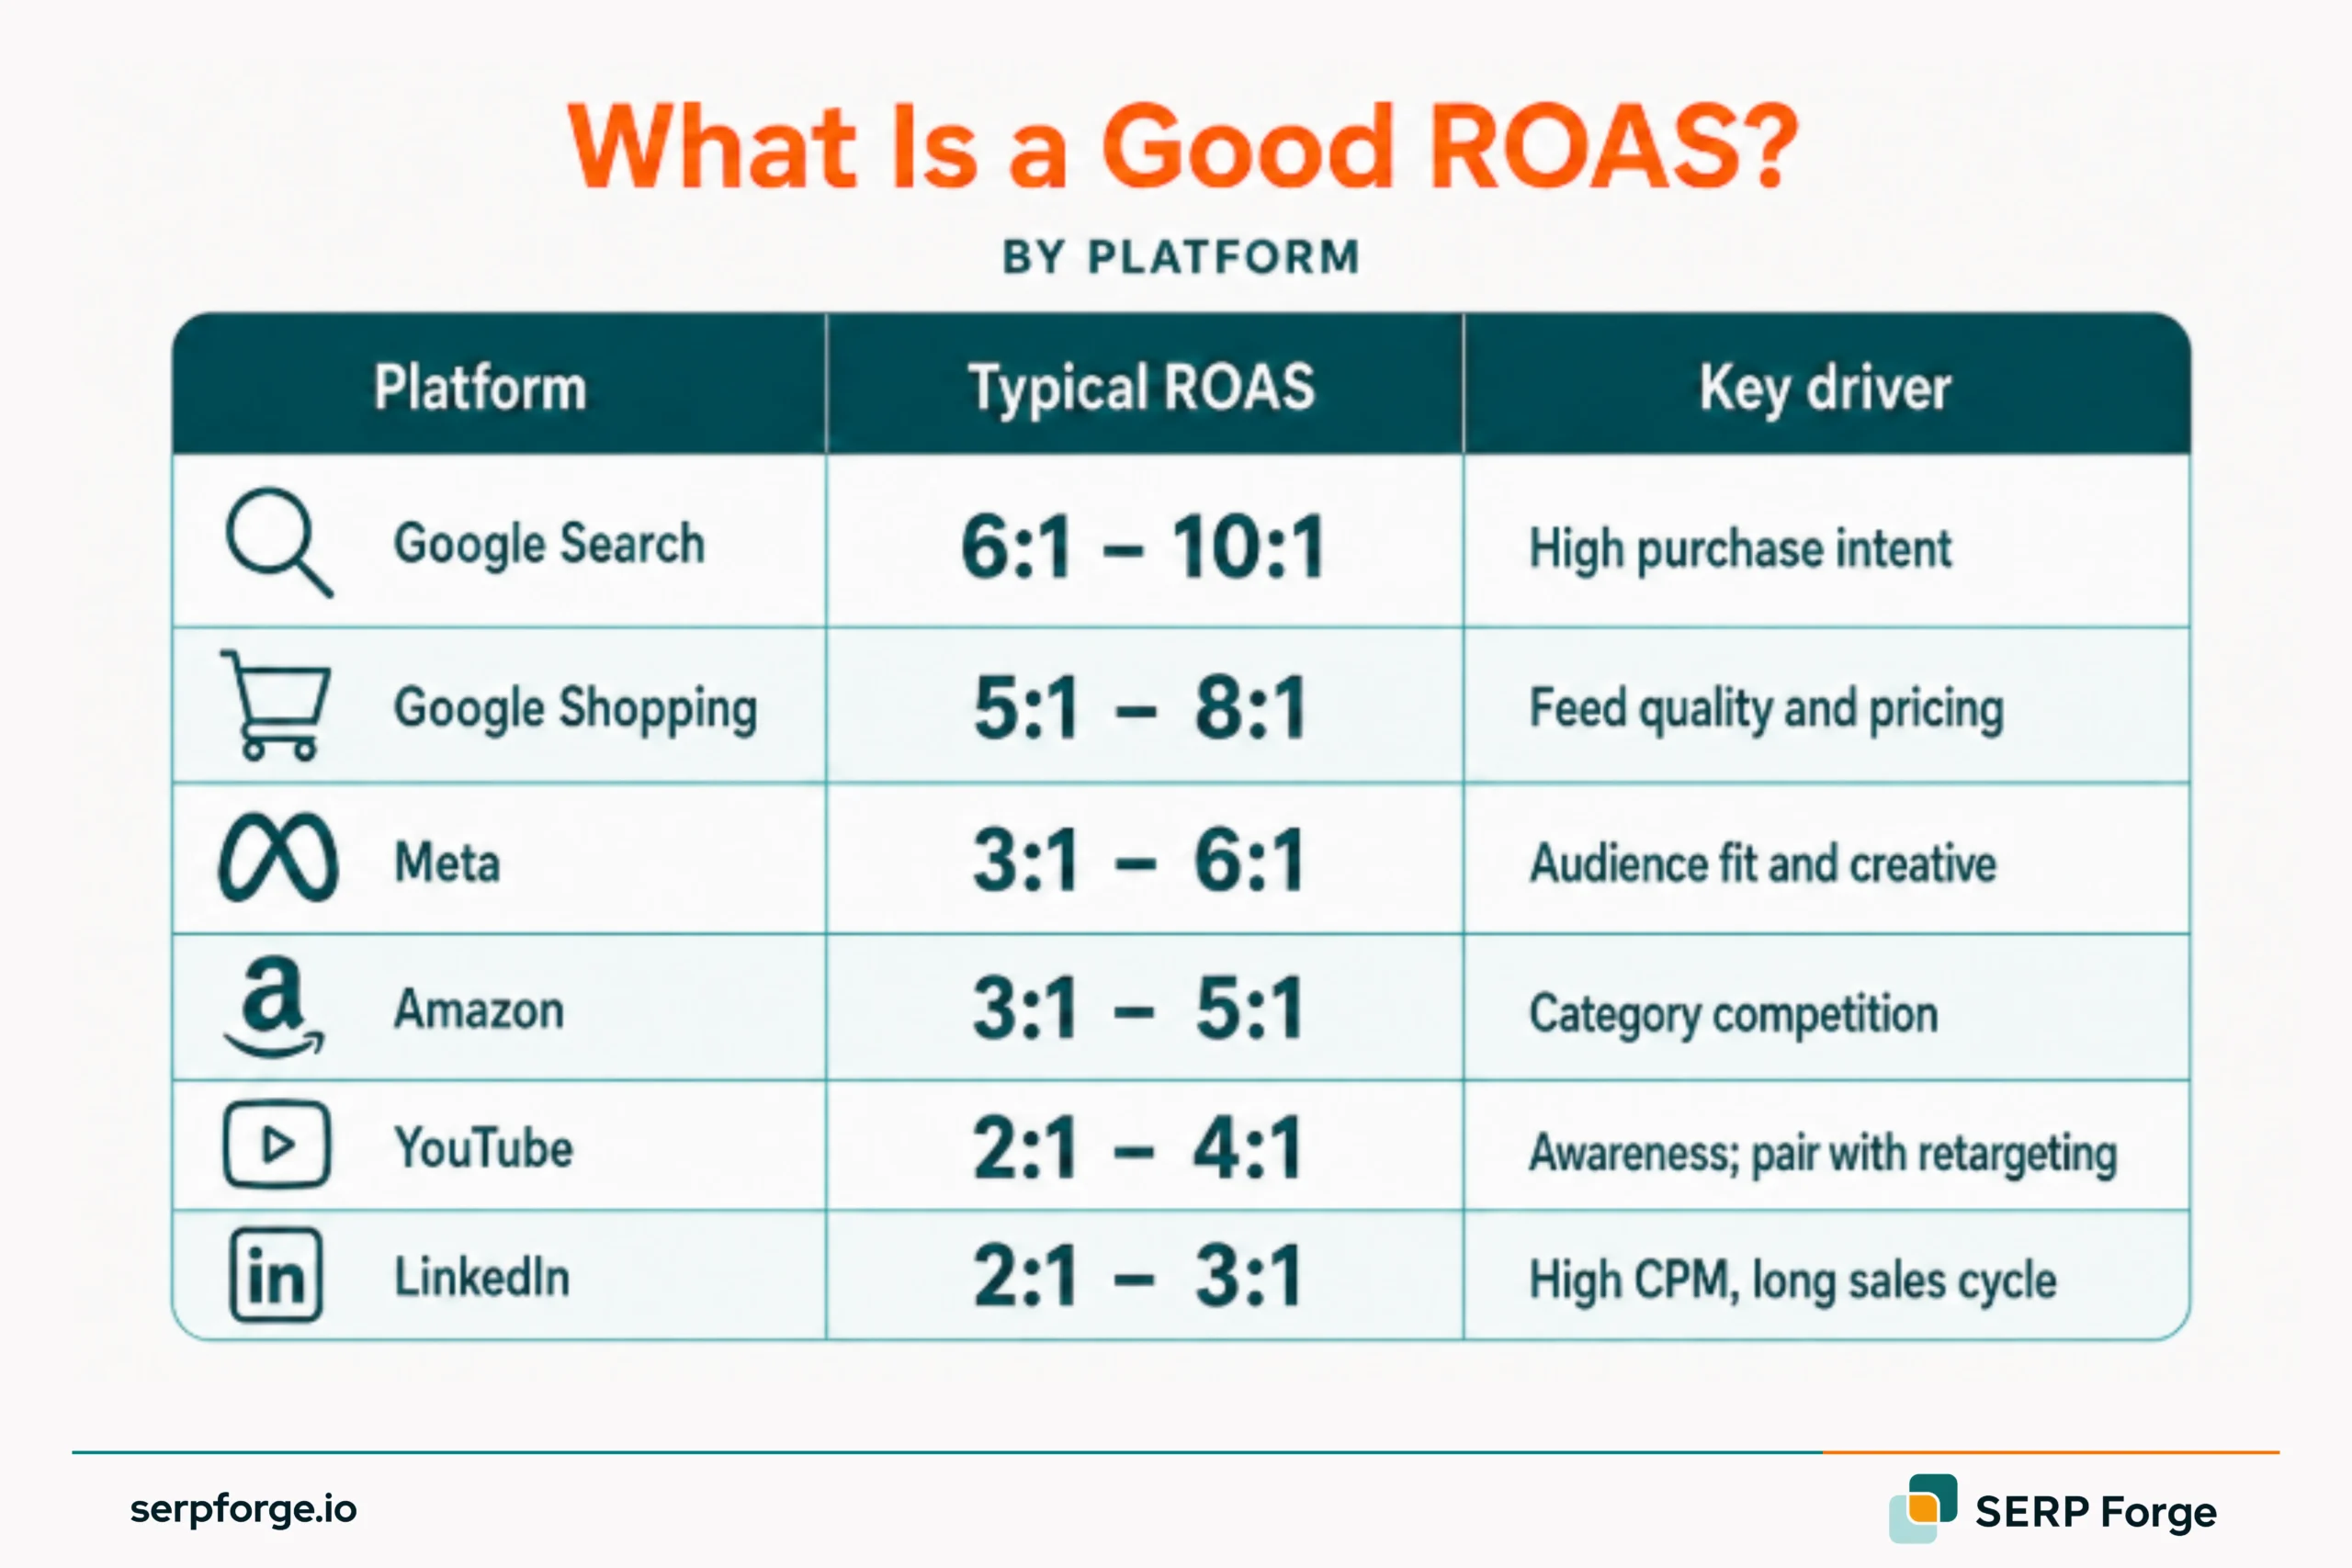
By platform:
| Platform | Typical ROAS | Key driver |
| Google Search | 6:1 – 10:1 | High purchase intent |
| Google Shopping | 5:1 – 8:1 | Feed quality and pricing |
| Meta | 3:1 – 6:1 | Audience fit and creative |
| Amazon | 3:1 – 5:1 | Category competition |
| YouTube | 2:1 – 4:1 | Awareness; pair with retargeting |
| 2:1 – 3:1 | High CPM, long sales cycle |
By gross margin:
| Gross Margin | Breakeven ROAS | Minimum Target |
| 20% | 5:1 | 6:1+ |
| 30% | 3.3:1 | 4.5:1+ |
| 50% | 2:1 | 3:1+ |
| 70% | 1.4:1 | 2:1+ |
- Below 2:1: Stop scaling. Diagnose first.
- 2:1 – 4:1: Fix before increasing budget.
- 4:1 – 7:1: Healthy for standard margins.
- 7:1+: Scale if margins support it.
How to Improve Your ROAS
Work through these in order before touching budget.
- Check tracking first: Verify your platform counts only revenue from users who clicked your ad, not everyone who visited within a broad window.
- Audience before creative: Look at who converted in the last 90 days. Build targeting from that data, not platform defaults.
- Separate by funnel stage: Cold audience needs problem-focused messaging. Warm audience needs a specific offer. Running both together gives the algorithm contradictory signals.
- Fix the landing page first: Page load above 3 seconds, a mismatched headline, or a different offer than the ad kills conversion rate before bids matter.
- Match bidding to goal: Target ROAS sends buyers. Maximising clicks sends traffic. Give any bidding change 30 to 50 conversions before evaluating.
FAQs
What is a good ROAS for Facebook ads?
Between 3:1 and 6:1 for most advertisers. Below 3:1 on a conversion campaign usually means a creative, audience, or landing page problem worth fixing before adding spend.
What is breakeven ROAS?
The ROAS at which your ad spend returns exactly what you spent, before overheads. Formula: 1 /Gross Margin. At 30% margin, breakeven ROAS is 3.3:1. Every sale below that loses money after product costs.
Does ROAS include organic revenue?
No. ROAS measures only revenue from paid spend. A wide tracking window can pull in sales that happened for other reasons and inflate the number. Use a window that matches your actual average time from ad click to purchase.
What ROAS should I target for ecommerce?
Start with your gross margin. Find your breakeven ROAS in the table above. Set your target one to two points above that to cover fulfilment, returns, and platform fees.
Can ROAS be negative?
No. Both inputs are positive numbers. But a ROAS below your breakeven means every sale is losing money after margin, even if the ratio looks positive.