




Free Click-Through Rate Calculator for Ads
This free CPM calculator solves for cost per thousand impressions, total campaign cost, or total impression count. Enter any two values and the third appears instantly. Use it before every media planning cycle to benchmark your cost per mille against the platform and industry ranges below.
What Is CPM in Advertising?
CPM stands for cost per mille mille being Latin for one thousand. It is the standard pricing model across display advertising, social media placements, programmatic inventory, video pre-rolls, and connected TV. Every time your ad loads on a screen, that registers as one impression. CPM tells you what one thousand of those loads costs.
One viewer seeing your ad five times during a session generates five impressions regardless of whether they click or convert.
CPM advertising captures the cost of all five. That is precisely why impression-based pricing works best for brand awareness campaigns, audience reach goals, and upper-funnel retargeting situations where frequency of exposure drives the outcome rather than immediate direct response.
How to Calculate CPM
Three formulas cover every scenario a media buyer encounters. Each solves for a different unknown depending on what you already know going into a campaign.
CPM Formula
Use this when you know what you spent and how many impressions were delivered. It gives you your effective CPM — the number to benchmark against platform averages and industry ranges.
CPM = (Total Ad Spend ÷ Total Impressions) × 1,000 Example: $400 ÷ 200,000 × 1,000 = $2.00 CPM
How to Calculate Total Campaign Cost From CPM
Use this when a publisher or platform quotes you a CPM rate and you need to know what a given impression target will cost before committing your ad budget.
Total Cost = (CPM × Impressions) ÷ 1,000 Example: $8 CPM × 500,000 impressions ÷ 1,000 = $4,000
How to Calculate Impressions From Budget and CPM
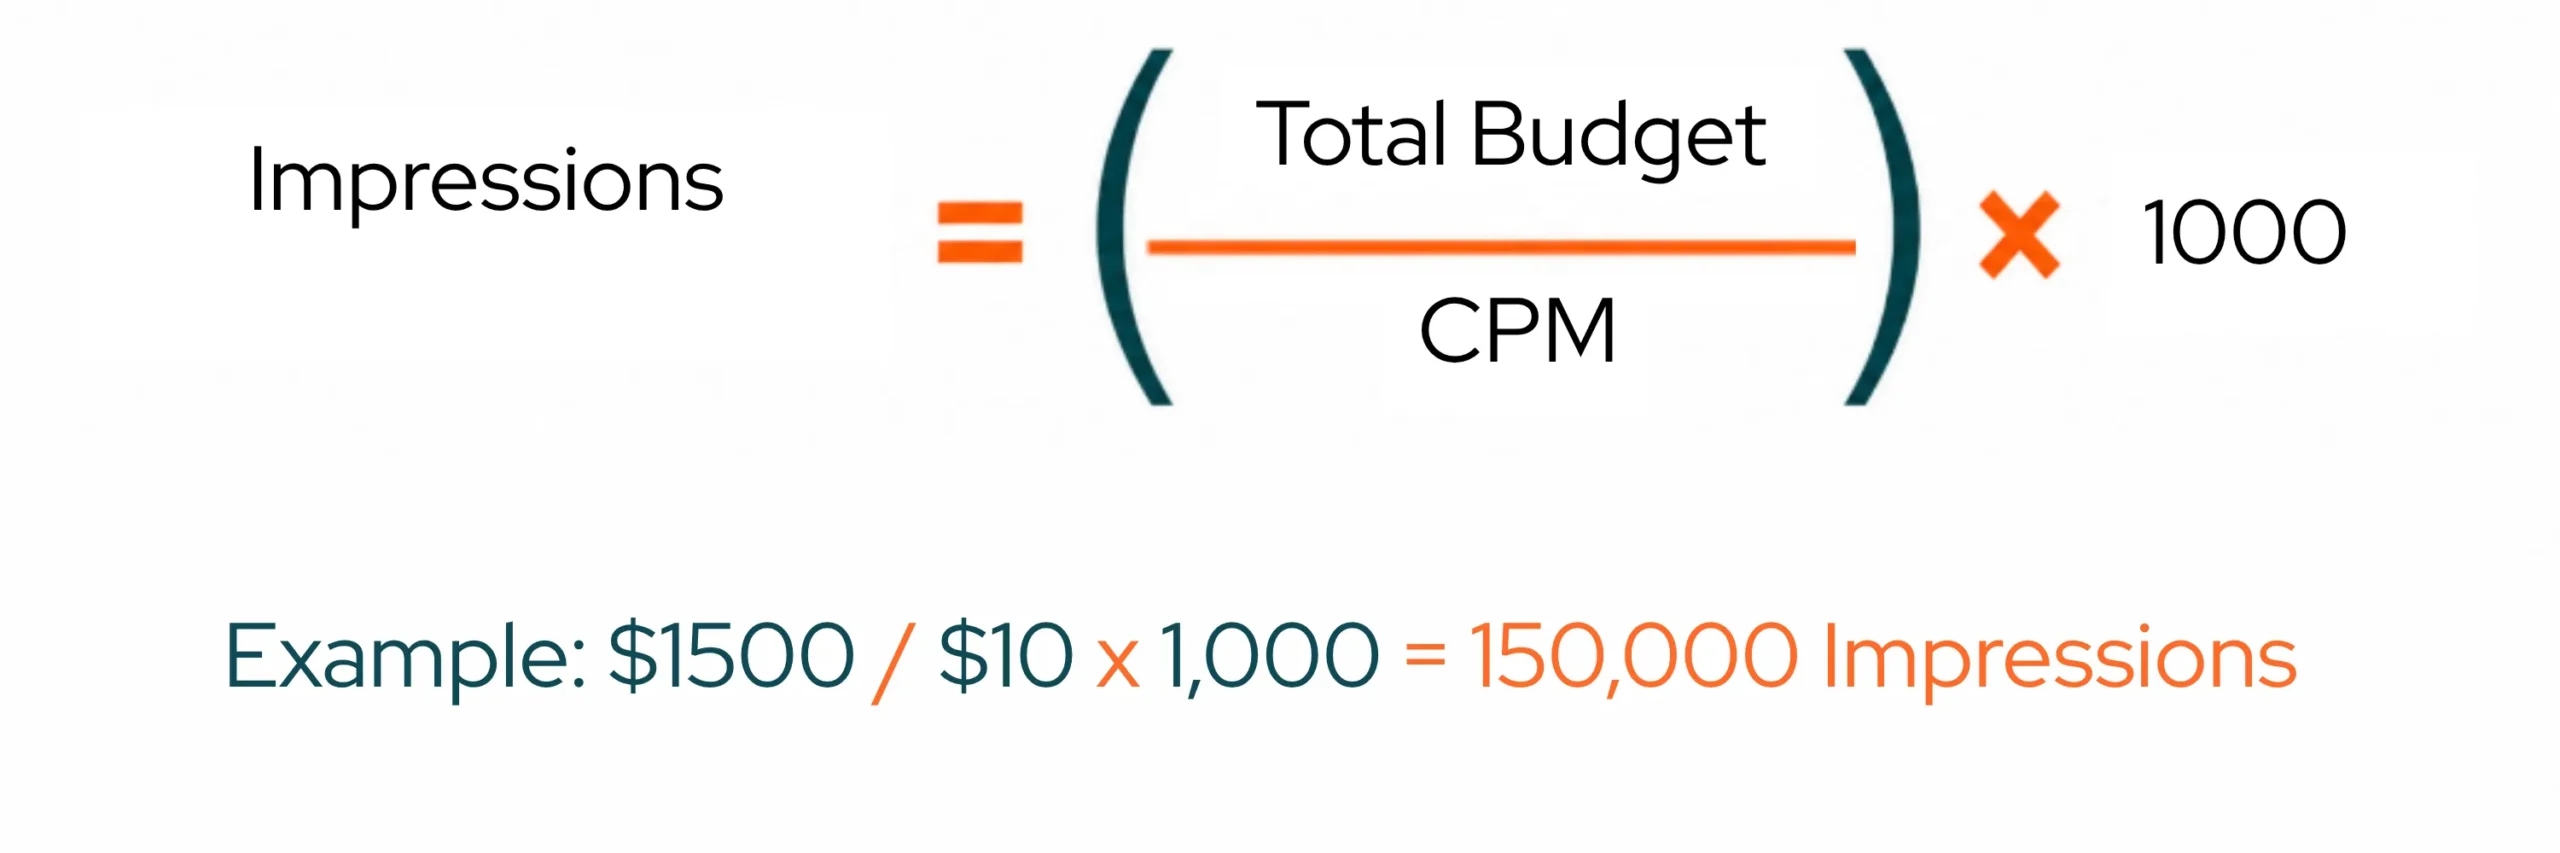
Use this before a campaign launches to estimate the reach your ad budget will buy at a given rate. This is the most common pre-flight calculation in paid media planning.
Impressions = (Total Budget ÷ CPM) × 1,000 Example: $1,500 ÷ $10 × 1,000 = 150,000 impressions
How to Use the CPM Calculator
The tool accepts any two of the three variables and solves for the third. Here is what goes in each field:
| Field | What to Enter | Example |
| Total Campaign Cost ($) | Total amount billed by the ad platform for the reporting period | $800 |
| CPM ($) | Rate quoted by the platform or calculated from past campaigns | $8.00 |
| Number of Impressions | Total impressions delivered or planned for the campaign | 100,000 |
Once you hit Calculate, the results panel shows your CPM, Total Cost, Impressions, Cost per Single Impression, the exact CPM formula used, and a benchmark flag telling you how your number compares to typical ranges for your placement type.
Use the output to compare cost efficiency across platforms, placements, and campaign objectives before committing your next media budget.
Average CPM by Platform in 2026
CPM advertising costs shift significantly across platforms because each runs a separate auction with a different pool of advertisers, audience sizes, and inventory quality signals. A media plan that relies on a single platform average will miss the real cost variance your budget will face in practice.
| Platform | Avg CPM (2026) | Cost Level | Best For |
| Google Display Network | $1–$5 | Low | Broad reach, retargeting audiences across web properties |
| Facebook / Meta | $7–$14 | Mid | Consumer retargeting, lookalike audience prospecting |
| $9–$13 | Mid | Product launches, visual brand building, 18–35 audiences | |
| YouTube | $4–$10 | Low | Video reach, brand storytelling, research-phase buyers |
| $31–$50 | High | B2B lead gen, account-based targeting, decision-makers | |
| X (Twitter) | $4–$7 | Low | Real-time engagement, tech and finance audiences |
| $24–$30 | High | Product discovery, lifestyle planners, home and fashion | |
| Connected TV / OTT | $20–$40 | High | Premium video reach, cord-cutter demographics |
LinkedIn CPMs run highest because the addressable audience of senior professionals is small and auction competition from B2B SaaS, financial services, and recruitment advertisers is intense. YouTube and Google Display hold lower CPMs because ad inventory volume is enormous relative to demand.
Seasonal note: CPM costs spike industry-wide in Q4 as retail advertisers flood every major auction. Q1 consistently offers the most cost-efficient window for buying display impressions at scale. If your awareness goals are not deadline-dependent, shifting budget to January–March typically improves impression volume for the same spend.
Average CPM by Industry in 2026
Platform benchmarks tell you the market rate for a placement. Industry benchmarks tell you whether your CPM reflects a well-structured campaign or a targeting problem specific to your vertical. The same $15 cost per mille is strong in e-commerce and a warning sign in education.
| Industry | Typical CPM Range | Primary Cost Driver |
| B2B SaaS / Software | $40–$55 (LinkedIn) · $7–$11 (Meta) | Narrow addressable audience; intense decision-maker bidding |
| Financial Services | $18–$30 (Meta / Display) | High customer LTV drives aggressive auction behaviour |
| Healthcare | $12–$26 | Regulatory targeting restrictions compress available inventory |
| E-commerce / Retail | $7–$15 | Huge addressable audiences keep auction prices competitive |
| Education | $4–$9 | Broad reach with lower advertiser competition |
| Real Estate | $19–$30 | High lead value with concentrated geo-targeted competition |
| Travel & Hospitality | $8–$18 | Seasonal spikes around holidays compress Q4 inventory |
B2B SaaS CPMs sit at the top of the scale because every advertiser in the category is bidding for the same pool of software decision-makers. E-commerce CPMs stay low because the audience measures in the hundreds of millions. Run your number from this CPM calculator against your industry row before deciding whether your result needs attention.
What Is a Good CPM?
A good CPM is one that delivers the audience you need at a cost your margins can support — not simply the lowest number available. A $3 cost per thousand impressions reaching users with no commercial intent will cost more in wasted downstream ad spend than a $25 CPM consistently putting your brand in front of ready buyers.
What a Low CPM Actually Signals
Below-benchmark CPMs often indicate one of two things: a genuinely large, underpriced audience, or a targeting setup reaching people too far outside your buyer profile to convert.
Before optimising for lower cost per mille, check your click-through rate and post-click behaviour. If both are weak, cheaper ad impressions are just cheaper waste.
What a High CPM Actually Signals
Above-benchmark CPMs are expected in categories where a single converted customer generates significant lifetime value. B2B SaaS, wealth management, and medical device advertising all operate at elevated impression costs because one acquired customer justifies the audience price.
A CPM running meaningfully above your own historical average is worth investigating. The three most common causes are creative relevance decay, an audience segment that has become over-targeted by competitors, and Q4 seasonal auction pressure.
When CPM Is the Wrong Metric Entirely
CPM measures exposure. When your campaign objective is revenue, it measures the wrong thing. If your primary KPI is cost per lead, cost per trial, or return on ad spend, CPM budgeting funds reach with no guarantee of action.
Divide your CPM by your expected CTR expressed as a percentage to find your implied cost per click, then compare that against your target cost per acquisition before deciding which advertising pricing model fits your campaign goal.
How to Improve Your CPM
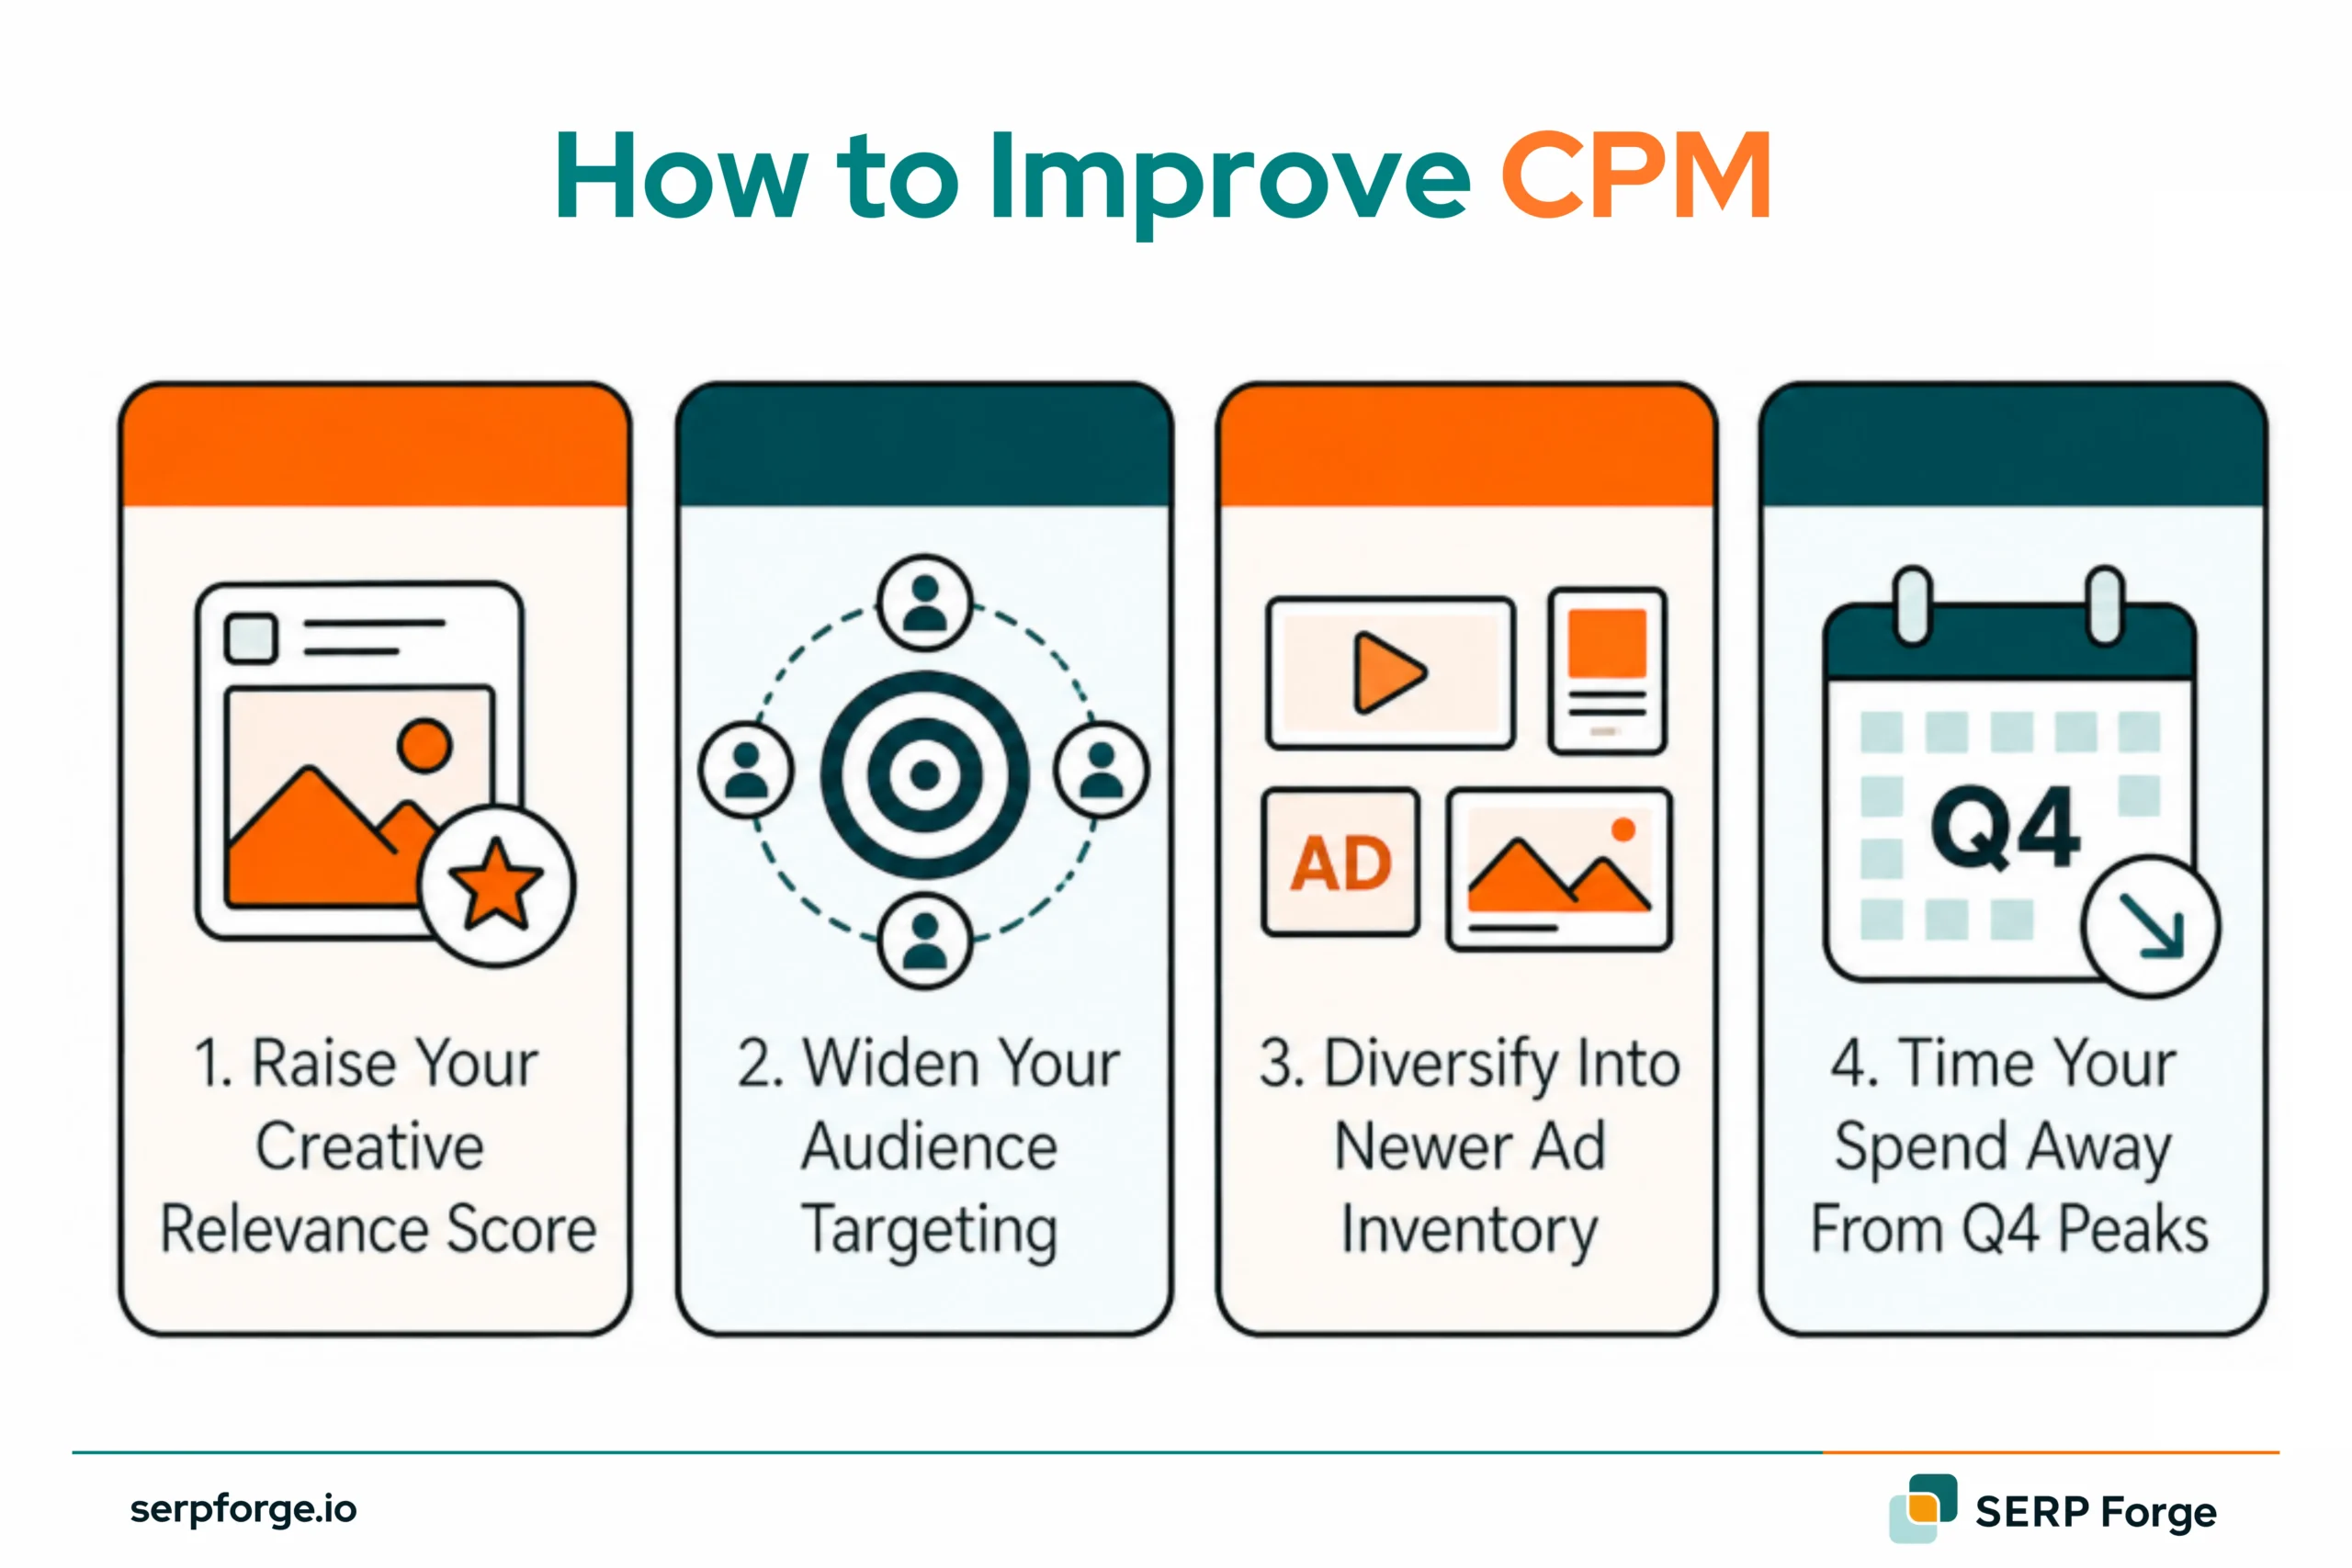
CPM reductions compound quickly. Dropping from $14 to $10 on a $10,000 monthly budget adds 40,000 incremental ad impressions with no increase in spend. These four levers move cost per mille most reliably.
- Raise Your Creative Relevance Score: Every major platform runs a quality auction alongside the price auction. Ads that earn higher engagement relative to their audience receive better inventory at lower CPM. Refreshing creative every four to six weeks prevents the relevance decay that quietly inflates programmatic advertising costs over time.
- Widen Your Audience Targeting: Over-segmented audiences trap you in expensive micro-auctions where a handful of advertisers bid aggressively for a tiny user pool. Loosening demographic, interest, or company-size restrictions introduces cheaper inventory tiers the algorithm can exploit without sacrificing lead quality in practice.
- Diversify Into Newer Ad Inventory: New placements Reels, Shorts, Threads, connected TV pre-rolls — are consistently underpriced in their first twelve to eighteen months because advertiser demand lags platform launch. Shifting a test budget to emerging inventory before your competitors do is one of the fastest structural ways to lower average CPM across a media plan.
- Time Your Spend Away From Q4 Peaks: Moving budget from October–December to January–March typically buys 20–40% more impressions for the same spend in most display and social placements. Seasonal demand from retail advertisers is the single biggest external force on CPM advertising costs across every major platform.

CPM vs CPC vs CPA: Choosing the Right Pricing Model
The billing model you choose in digital advertising determines what you optimise for and what risk you carry. Here is how the three standard advertising pricing models compare for real campaign decisions.
| Model | You Pay For | Best Campaign Goal | Cost Predictability | Risk Level |
| CPM | Every 1,000 ad impressions | Brand awareness, reach, retargeting frequency | Very high — fixed before spend | Low |
| CPC | Every click on your ad | Traffic, mid-funnel intent pages, lead gen | Medium — depends on CTR | Medium |
| CPA | Every completed action | Direct response, conversion campaigns | Low — platform-set rate | Low for advertiser |
When to Use CPM
CPM suits campaigns where brand reach and frequency drive the outcome rather than immediate response. Product launches, broad awareness pushes, and retargeting audiences already familiar with your brand all fit impression-based pricing naturally.
You know your cost per thousand impressions before spending a dollar; budget forecasting is clean, predictable, and easy to report against reach and impression share targets.
When to Use CPC
CPC is the right model when you only want to pay for demonstrated intent. Comparison pages, demo landing pages, and pricing pages all perform better under cost-per-click because you fund only users who clicked through.
If your CPM is high and CTR is consistently low, switching to CPC removes the exposure cost and ties your ad spend directly to traffic performance.
When to Use CPA
CPA works when conversion tracking is mature and campaigns carry enough historical data for the platform algorithm to optimise toward specific actions.
You pay only when a form submission, free trial sign-up, or purchase completes. Publishers price the performance guarantee into the CPA rate you will pay more per action than a well-optimised programmatic buying campaign would imply at the same conversion volume. Without sufficient conversion history, CPA campaigns under-deliver on volume.
Most mature paid media programs use all three models simultaneously: CPM for awareness and retargeting, CPC for mid-funnel intent pages, and CPA for high-volume conversion campaigns where the algorithm has enough data to optimise efficiently.
CPM Calculation Example
Here is a worked example using a realistic display advertising scenario for a SaaS brand running a LinkedIn awareness campaign.
Inputs: $6,000 total ad spend · 240,000 impressions delivered · 0.45% click-through rate
| Metric | Calculation | Result |
| CPM | ($6,000 ÷ 240,000) × 1,000 | $25.00 per 1,000 impressions |
| Cost per Impression | $6,000 ÷ 240,000 | $0.025 per single ad load |
| Implied Clicks | 240,000 × 0.45% | 1,080 clicks |
| Implied CPC | $6,000 ÷ 1,080 | $5.56 per click |
| Benchmark (LinkedIn B2B) | $31–$50 avg CPM (2026) | Below benchmark efficient for the platform |
At $25.00 CPM, this campaign sits below LinkedIn’s 2026 average of $31–$50. The implied CPC of $5.56 is useful context before deciding whether to switch to a cost-per-click model.
If the landing page converts at 5%, that CPC implies a $111 cost per lead, which falls within the normal range for B2B SaaS acquisition.
Frequently Asked Questions
What does CPM stand for in advertising?
Cost per mille is Latin for one thousand. It is the standard unit for pricing ad impressions across digital advertising and programmatic platforms.
How do I calculate CPM from budget and impressions?
Divide total ad spend by total impressions, then multiply by 1,000. CPM = (Ad Spend ÷ Impressions) × 1,000 Example: $800 ÷ 400,000 × 1,000 = $2.00 CPM.
What is a good CPM for Google Display Network?
$1–$5 for broad audiences. Finance and healthcare push above $10. Your own historical CPM paired with actual CTR and conversion rate is a more reliable benchmark than any platform average.
Why is my CPM suddenly higher this month?
Three causes cover most spikes: Q4 auction pressure, an over-targeted audience, or a drop in creative relevance score. Refresh your creative, check audience overlap, and review spend timing.
Is a lower CPM always better?
No. A $3 CPM reaching the wrong audience wastes more money than a $30 CPM reaching ready buyers. Always pair CPM with CTR, view-through rate, and cost per acquisition.
What is the difference between CPM and vCPM?
CPM counts every ad load. vCPM counts only impressions where 50% of the ad was visible for at least one second. vCPM is the stronger signal for brand awareness campaigns.
When should I switch from CPM to CPC or CPA?
Switch to CPC when you need intent-driven traffic. Switch to CPA when conversion tracking is mature. Use CPM when reach and frequency are the goal.