




What Is MQL to SQL Conversion Rate?
The MQL to SQL conversion rate tells you how many of your marketing-qualified leads are accepted by sales as ready to work. It is the most direct measure of alignment between your marketing and sales teams.
A high rate means sales trusts the leads coming in. A low rate means something is off: in how leads are scored, how they are nurtured, or how both teams define “qualified.”
MQL to SQL Conversion Rate Formula
The MQL to SQL formula has three inputs: total SQLs accepted, total MQLs passed, and a multiplication by 100 to express the result as a percentage. Get this wrong and every downstream metric, from pipeline forecast to sales capacity planning, is built on a false number.
How to Calculate MQL to SQL Conversion Rate
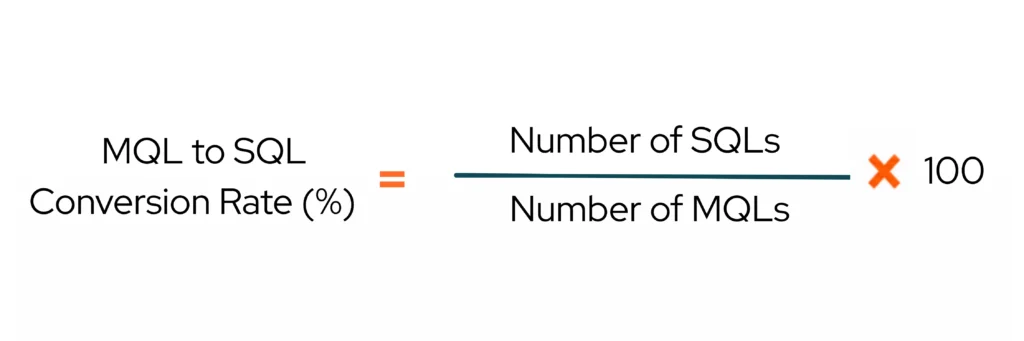
MQL to SQL Conversion Rate (%) = (Number of SQLs/Number of MQLs) x 100
Example Calculation
Your marketing team generated 500 MQLs this month. Sales reviewed them and accepted 175 as sales-ready.
(175/500) x 100 = 35%
That puts you in a healthy range. Run your own numbers through the MQL to SQL calculator above to see where you stand.
How to Use Our MQL to SQL Conversion Rate Calculator
This calculator is built for marketing ops teams, demand generation managers, and RevOps leads who need a fast read on funnel efficiency. Here is what goes in each field:
| Input | What to Enter |
|---|---|
| Total Marketing Qualified Leads (MQLs) | Total number of Marketing Qualified Leads |
| Total Sales Qualified Leads (SQLs) | Total number of Sales Qualified Leads |
Once you hit Calculate MQL to SQL Conversion, the results panel shows two outputs:
- MQL to SQL Conversion Rate displayed as a percentage, showing exactly how many MQLs converted to SQLs
- Formula showing the exact calculation used: MQL to SQL Conversion Rate (%) = (Total SQLs ÷ Total MQLs) × 100
All values are used only for calculation and are not stored. Use the result against the benchmark tables below to judge whether your number is healthy. If your rate drops two months in a row, treat it as a pipeline problem, not a reporting footnote. A low rate with high MQL volume means leads are entering the funnel but not clearing the qualification bar sales has set.
What Is a Good MQL to SQL Conversion Rate?
The 20% to 40% range covers most B2B companies, but that range is built on aggregated data across industries, stages, and channels. Comparing yourself to a blended benchmark when you sell enterprise software through a seven-month sales cycle will give you the wrong read. Use the tables below to find the benchmark that applies to your situation:
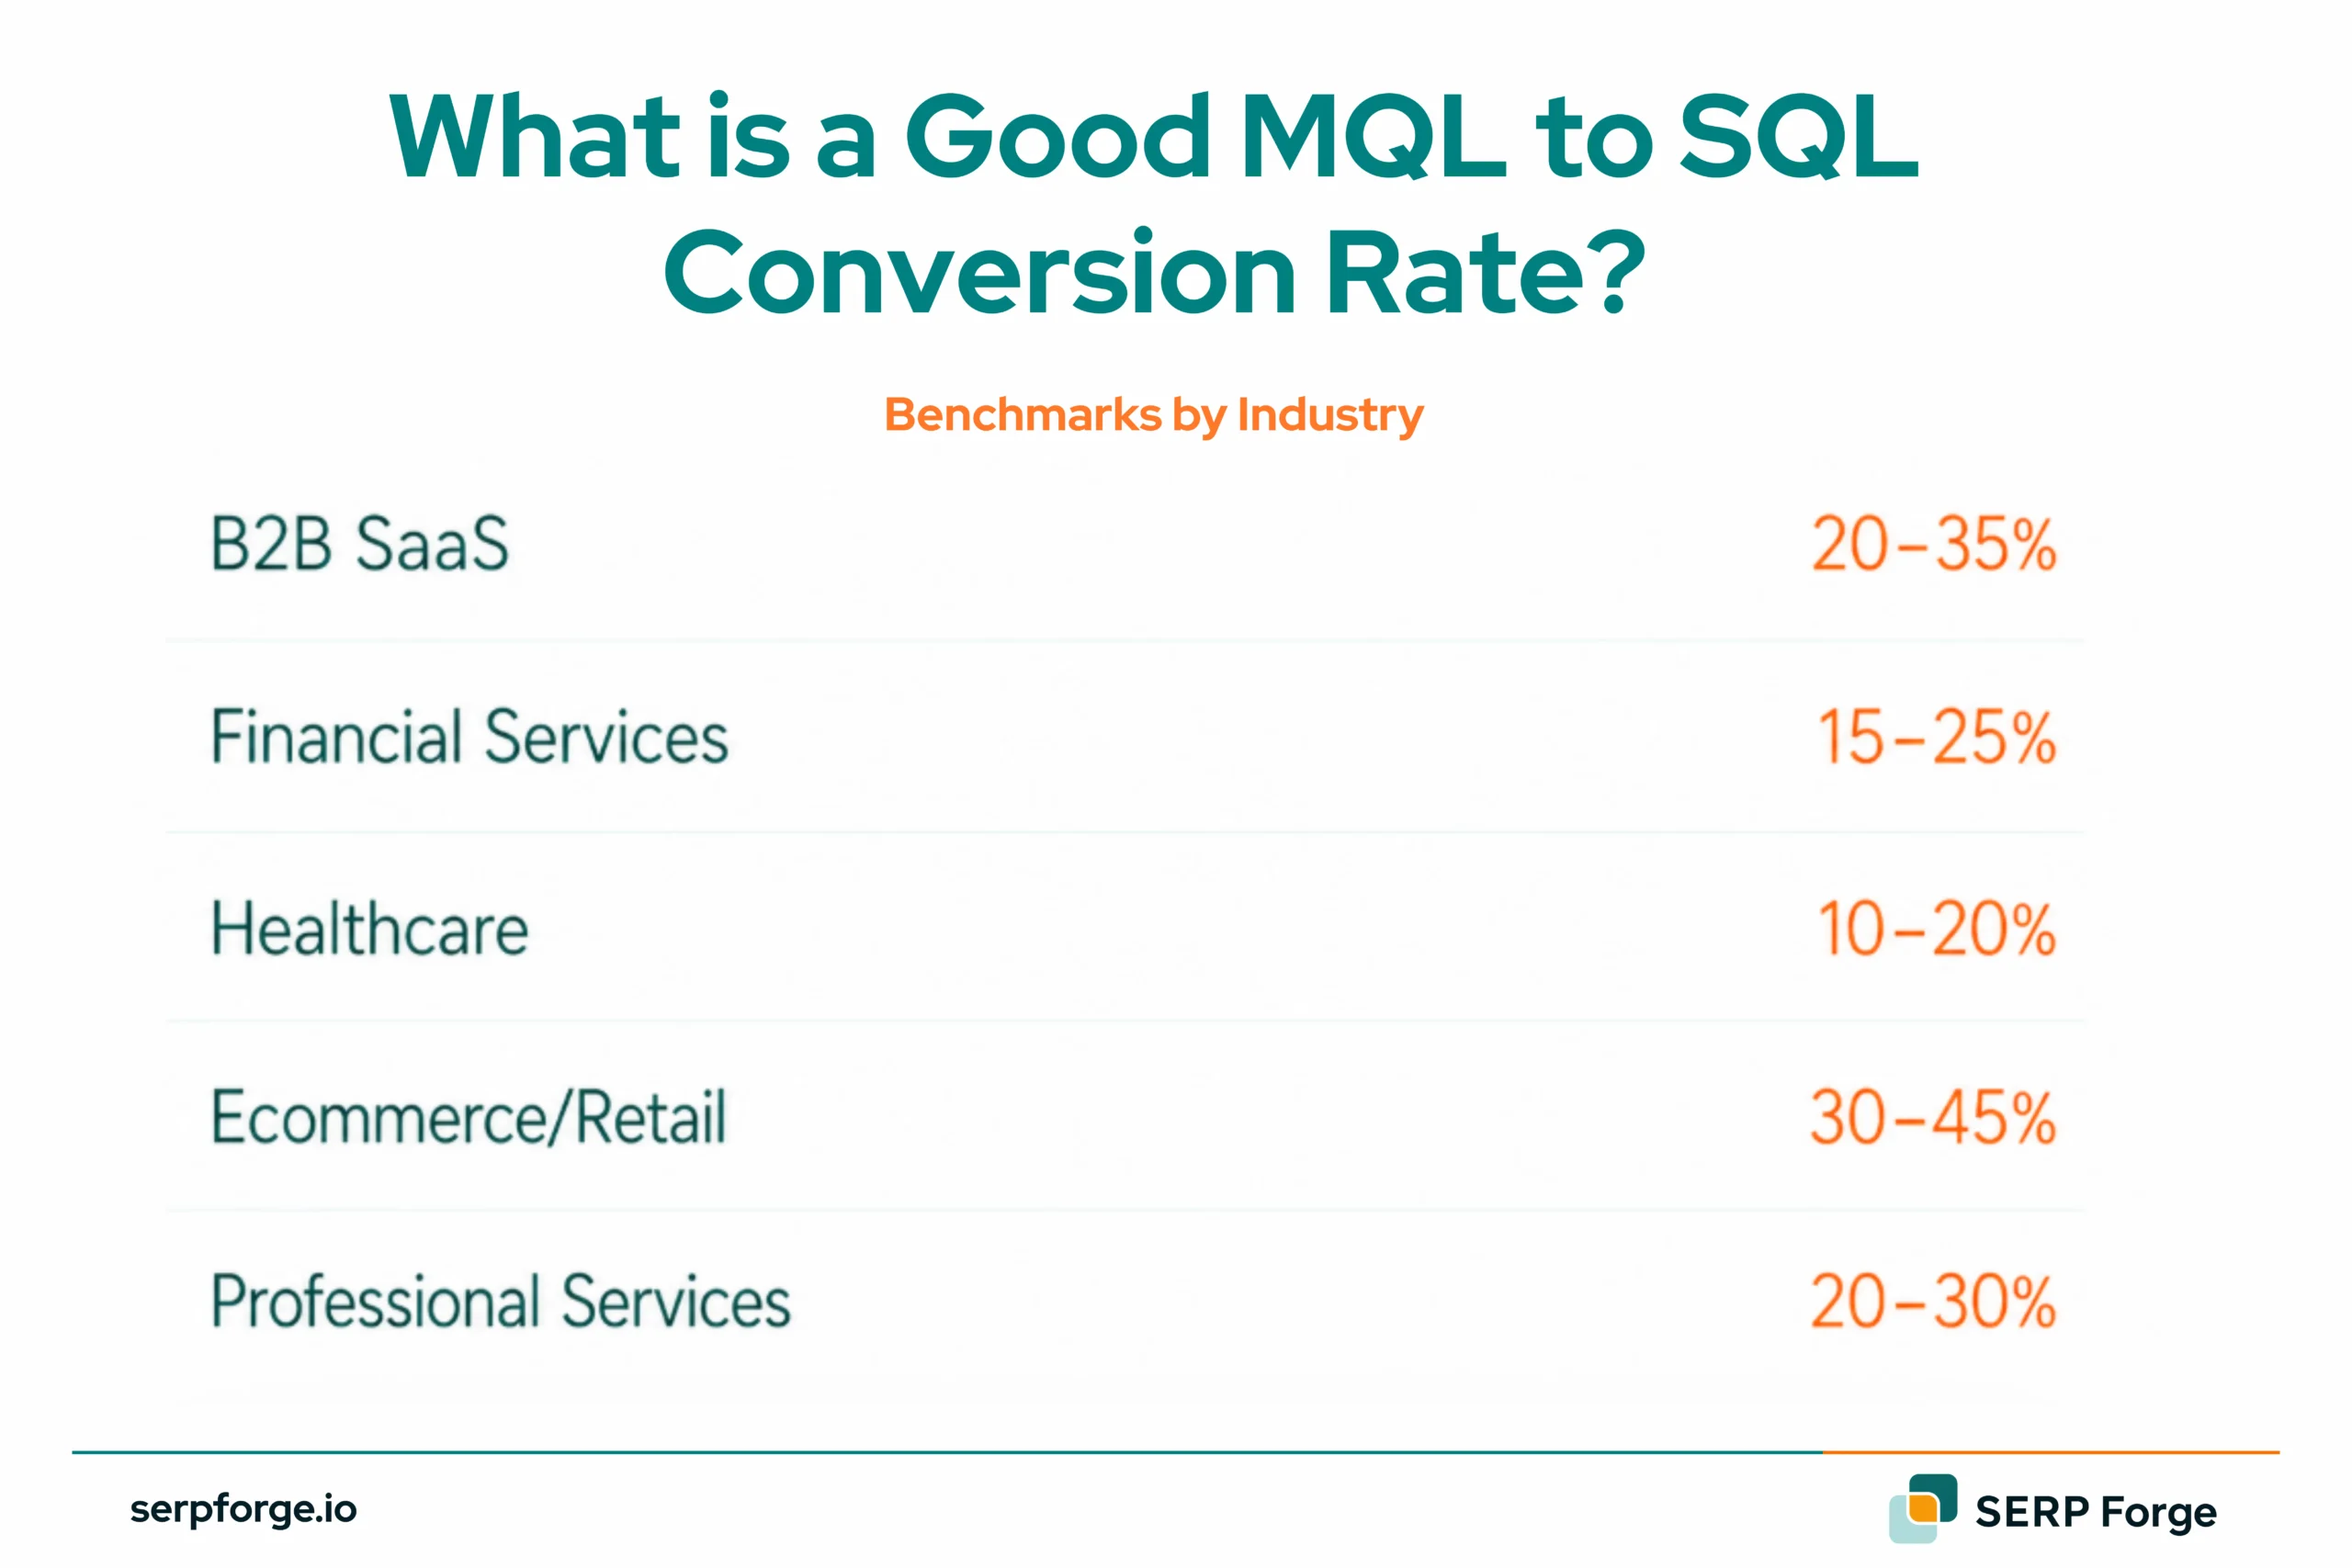
Benchmarks by Industry
| Industry | Avg MQL to SQL Rate | Notes |
|---|---|---|
| B2B SaaS | 20–35% | Longer sales cycles; ICP targeting drives most of the variance |
| Financial Services | 15–25% | Compliance requirements slow qualification; fewer leads pass BANT |
| Healthcare | 10–20% | Regulatory targeting limits shrink the qualified pool |
| Ecommerce/Retail | 30–45% | Shorter buying cycle; behavioural intent signals are easier to read |
| Professional Services | 20–30% | Referral leads convert significantly above average; cold leads pull the rate down |
Benchmarks by Company Stage
The same 25% rate means something different at seed stage versus Series C. Early-stage teams are still learning who their best customer is. Later-stage teams have closed enough deals to build scoring models on real data.
| Stage | Typical Range | Why |
|---|---|---|
| Early Stage (Seed–Series A) | 10–20% | ICP is still being defined; lead scoring is built on assumptions, not closed-won patterns |
| Growth Stage (Series B–C) | 25–40% | ICP is clearer; scoring has been tested against real pipeline data |
| Scale/Enterprise | 35–55% | Tight ICP, dedicated SDR function, and SLA-backed handoff process |
Why the Rate Varies by Channel
Your aggregate lead qualification rate hides the real story. A blended 30% can mask a paid search rate of 52% and a content syndication rate of 9%. Each channel brings leads at a different intent level:
- Paid search: The lead searched for a solution. Intent is high. These convert above average.
- Content downloads: The lead is researching. They may be months from a buying decision. Conversion rates are lower and nurture sequences matter more.
- Webinar registrants: Mid-funnel. Conversion depends heavily on follow-up speed. Leads contacted within 24 hours convert two to three times higher than leads contacted after 72 hours.
- Social and display: Cold audience. Lowest intent. Expect the weakest MQL SQL conversion rate from these sources regardless of how the ad performed.
Track your rate by channel before drawing conclusions from the overall number.
Why Is Your MQL to SQL Conversion Rate Low?
A rate below 20% is almost always at the boundary between marketing and sales. Check scoring first, then targeting, then the handoff. Most teams find the problem in that order.
- Weak Lead Scoring Model
Your model rewards activity, not fit. Pull 12 months of closed-won data, rebuild scoring around attributes that appeared in those deals, and remove everything else. Once scoring is clean, check what targeting is feeding it.
- Poor ICP Targeting
A clean scoring model still fails if the wrong leads are entering it. Run a cohort analysis on your best customers, map what they shared before they signed, and rebuild targeting around that. If both look healthy, the problem is usually the handoff.
- Misalignment Between Marketing and Sales
Marketing passes at 50 scoring points. Sales expects budget, authority, and timeline. No threshold fixes a definitional gap. Write a shared SLA and review it monthly.
- Slow Sales Follow-Up
If scoring, targeting, and alignment look fine, follow-up speed is where the rate is leaking. Leads contacted within five minutes are nine times more likely to qualify than those reached after 30 minutes.
How to Improve MQL to SQL Conversion Rate
The rate improves when leads are better matched to what sales can close, not when marketing passes more of them. These four fixes work in order of impact.
- Refine Lead Scoring Criteria
Find five to seven attributes that appear in closed-won deals. Weight those and cut everything that does not predict revenue. This gives targeting something accurate to work with.
- Tighten ICP Definition
Take your top 20% of customers by revenue and retention. List what they share firmographically and feed that into paid targeting, outbound, and content. Better-fit leads need less nurturing to reach sales-readiness.
- Improve Lead Nurturing Sequences
Research-stage leads: educational sequence. High-intent leads: short sequence, direct call-to-action. Warm them before the handoff to reduce rejections at the SQL stage.
- Align Sales and Marketing on Qualification Rules
All three fixes above lose impact without a shared definition. Review rejected leads together monthly. The rejection pattern tells you exactly where to adjust next.
FAQs
What is a good MQL to SQL conversion rate?
Between 20% and 40% for most B2B companies. Elite teams hit 50% or above. Below 20% points to scoring, targeting, or handoff problems. A 22% rate is healthy for an early-stage healthcare company and a warning sign for a growth-stage SaaS business with a mature scoring model.
What is the difference between MQL and SQL?
An MQL has shown enough engagement to be worth sales review. An SQL has been reviewed and accepted as ready for outreach. Marketing owns MQL quality. Sales owns follow-up speed.
Why does MQL to SQL rate fluctuate by channel?
Intent varies by channel. Paid search leads arrive ready to evaluate and convert well. Content leads are researching and need nurturing. Social leads are cold and take the longest to qualify. Track your MQL SQL conversion rate by channel to see where the funnel leaks.
How often should MQL to SQL rate be tracked?
Monthly at minimum. Always review it alongside pipeline coverage and win rate. A rate that drops two months in a row while pipeline also falls is a revenue problem, not just a metric.
Can poor lead scoring hurt MQL to SQL conversion?
Yes, and it is one of the most common causes of a low lead qualification rate. A model that weights activity over fit surfaces leads with no real budget or authority. Rebuild scoring against closed-won data annually and review against rejected leads every quarter.