
SaaS businesses run on data, but not all metrics drive real growth: the challenge is knowing which ones actually matter and how to use them effectively.
Many teams track dozens of KPIs without clear direction: this often leads to high CAC, rising churn, and slow or inconsistent growth.
If you’re not tracking the right SaaS metrics, you risk making decisions based on incomplete or misleading data.
This guide breaks down the most important SaaS metrics across revenue, retention, and acquisition: helping you understand what to track, how to calculate it, and how each metric impacts your growth.
What Are SaaS Metrics?
SaaS metrics are measurable data points that track the performance of a subscription-based business: they help you understand revenue growth, customer behavior journey, and overall business efficiency.
These metrics also help you identify bottlenecks in your SaaS funnel, improve product-market fit, and make better revenue forecasting decisions.
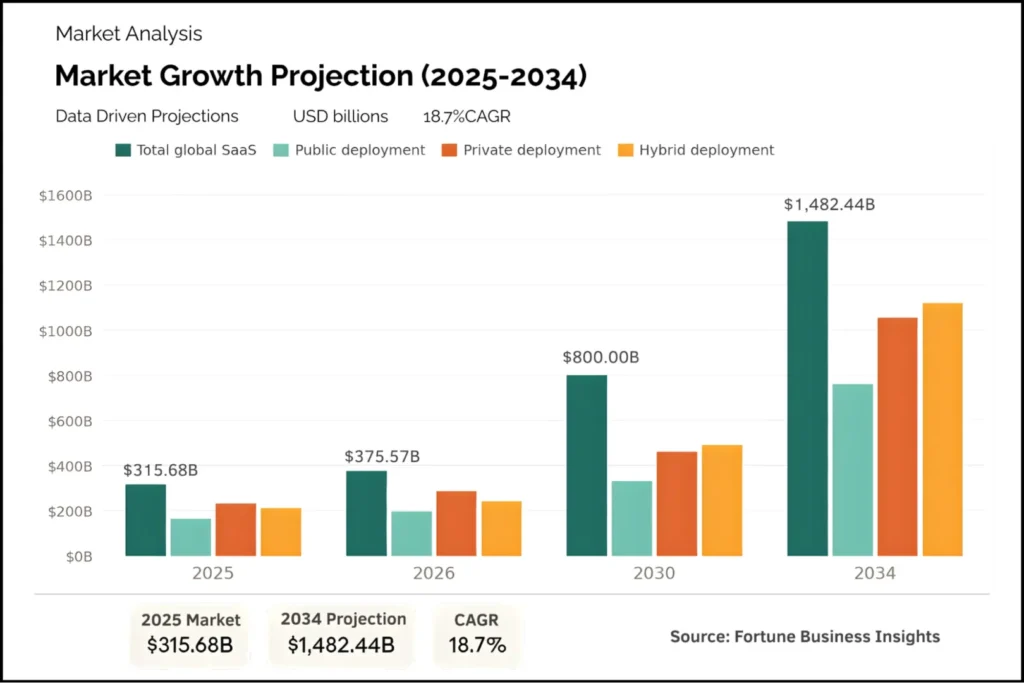
According to Fortune Business Insights, the global Software as a Service (SaaS) market was valued at USD 315.68 billion in 2025. It is expected to grow significantly, reaching USD 375.57 billion in 2026 and projected to hit USD 1,482.44 billion by 2034.
15 Key SaaS Metrics Every Business Should Track
Tracking the right SaaS metrics helps you understand revenue, customer behavior, and growth efficiency.
These 15 key metrics give a clear view of performance and help identify what needs to improve for sustainable scaling:
Financial health and revenue metrics
In SaaS (Software as a Service) businesses, financial metrics focus on recurring revenue, profitability, and unit economics: they help track subscription revenue, revenue growth, and overall SaaS performance.
These SaaS KPIs are essential for understanding predictable income, cost recovery, and long-term scalability.
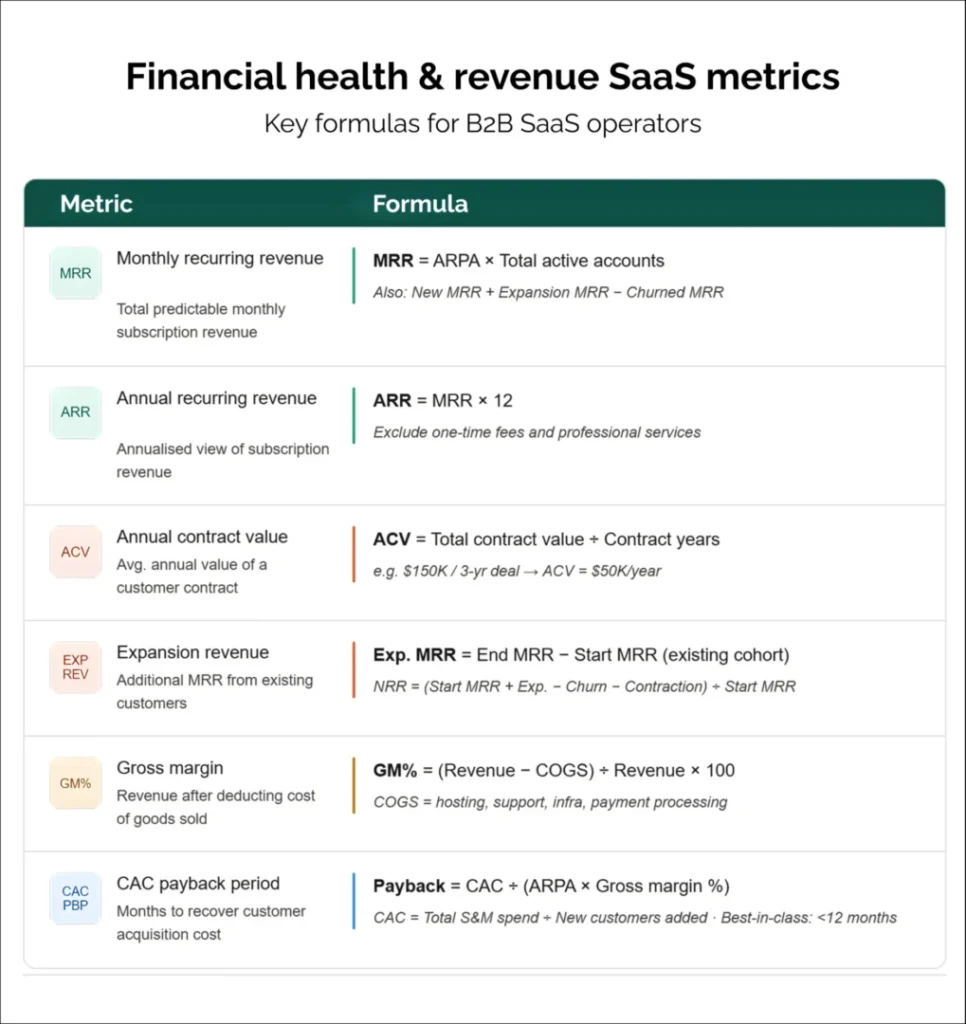
1. Monthly Recurring Revenue (MRR)
Monthly recurring revenue represents predictable monthly subscription revenue.
According to HubSpot, consistent MRR growth is a strong indicator of product-market fit and scalable demand.
A healthy MRR growth rate is around 10–20% month-over-month, in line with benchmarks. This metric is most important in the early and growth stages to track consistent revenue momentum.
If MRR growth is slow, focus on improving conversions or reducing churn, while strong growth signals scaling opportunities.
MRR directly helps in revenue forecasting and setting realistic growth targets.
Formula:
MRR = Sum of all monthly subscription revenue
Example:
If you have 100 customers paying $100/month, your MRR = $10,000
2. Annual Recurring Revenue (ARR)
Annual recurring revenue (ARR) measures total yearly recurring revenue: it provides a long-term view of SaaS revenue growth and business stability.
Strong SaaS companies often aim for 30%+ year-over-year ARR growth. It becomes more critical in the growth and scaling stages for long-term planning.
If ARR growth slows, revisit your sales pipeline or expansion strategies. ARR is widely used for financial planning and business valuation decisions.
Formula:
ARR = MRR × 12
Example:
If your MRR is $10,000, your ARR = $120,000
3. Annual Contract Value (ACV)
Annual contract value (ACV) calculates the average yearly revenue per customer contract: it helps measure deal size and sales efficiency.
Higher ACV generally indicates stronger enterprise deals and better revenue quality. This metric matters more for mid-market and enterprise-focused SaaS.
If ACV is low, consider revising pricing tiers or upsell strategies. It helps define your ideal customer profile and sales focus.
Formula:
ACV = Total contract value ÷ Number of years
Example:
If a contract is worth $30,000 for 3 years, ACV = $10,000
4. Expansion Revenue
Expansion revenue refers to additional revenue from existing customers: it includes upsells, cross-sells, and add-ons.
A strong benchmark is generating 10–30% of revenue from expansion. It becomes important during the growth stage when scaling existing accounts.
Low expansion revenue indicates a need to improve product adoption or upsell flows. This metric directly impacts net revenue retention and overall growth.
Formula:
Expansion Revenue = Revenue from upgrades + add-ons + cross-sells
Example:
If existing customers upgrade plans worth $5,000 and buy add-ons worth $2,000, expansion revenue = $7,000
5. Gross Margin
Gross margin measures the percentage of revenue left after deducting service delivery costs: it reflects SaaS profitability and efficiency.
Most SaaS businesses aim for a 70–85% gross margin. It is important across all growth stages for profitability tracking.
If margins are low, optimize infrastructure or service delivery costs. Gross margin determines how much you can reinvest into growth.
Formula:
Gross Margin = (Revenue – Cost of Goods Sold) ÷ Revenue × 100
Example:
If revenue is $50,000 and costs are $15,000, gross margin = 70%
6. Payback Period (CAC Payback Period)
The CAC payback period measures how long it takes to recover the customer acquisition cost: it shows how quickly your business becomes profitable per customer.
A good benchmark is under 12 months, ideally between 6 and 9 months. This is especially critical in the early and growth stages for managing cash flow.
If the payback period is high, reduce Saas CAC or improve pricing. It helps ensure sustainable scaling without cash burn risks.
Formula:
CAC Payback Period = CAC ÷ Monthly revenue per customer
Example:
If CAC is $1,200 and the monthly revenue per customer is $200, the payback period = 6 months
Customer value and retention metrics
In SaaS (Software as a Service) businesses, retention metrics focus on customer loyalty, revenue stability, and long-term value: they help track churn, customer lifetime value, and revenue retention.
These SaaS KPIs are critical for understanding how well you retain customers and maximize revenue from existing users.
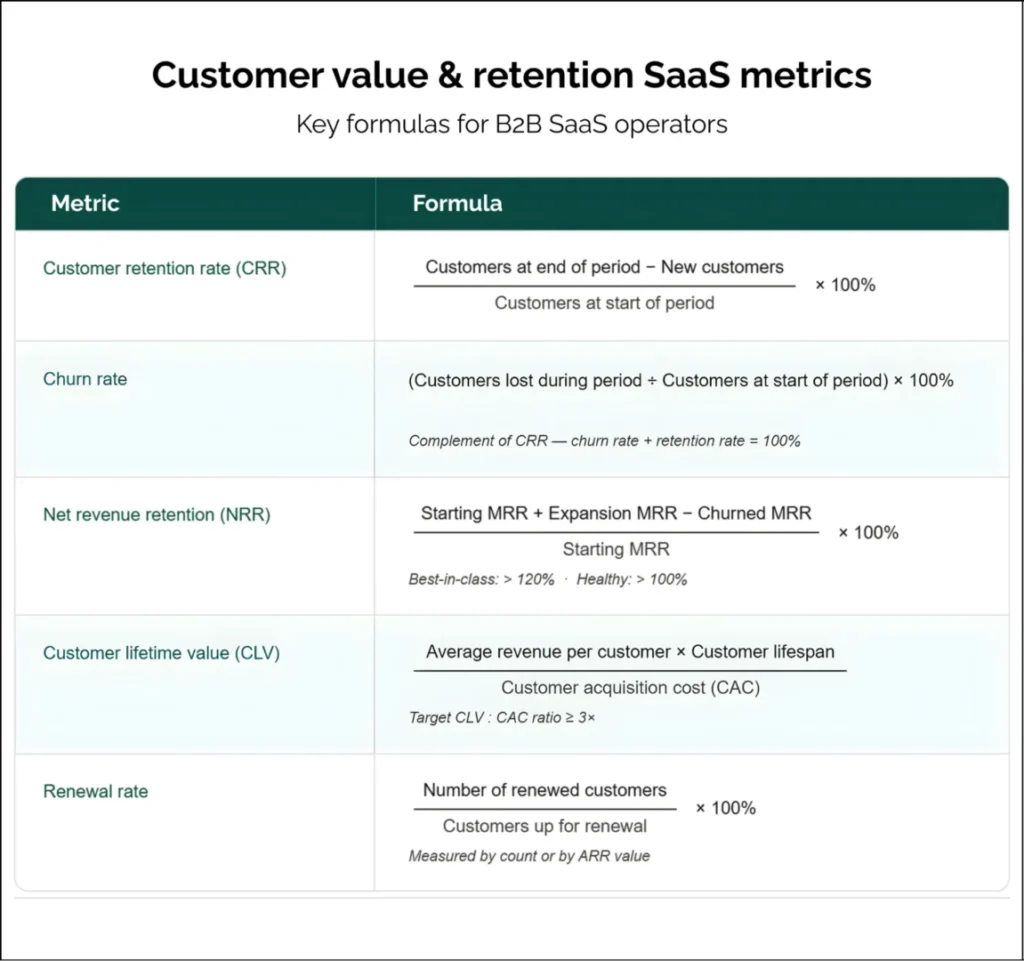
7. Customer Retention Rate (CRR)
Customer retention rate (CRR) measures the percentage of customers you retain over a specific period: it shows how effectively your SaaS keeps its users.
A strong retention rate is typically 85–95% or higher annually. It is crucial from the early stage to validate product-market fit.
Low retention means improving onboarding, support, or product value. Retention directly impacts long-term revenue stability.
Formula:
CRR = [(Customers at end of period – New customers) ÷ Customers at start] × 100
Example:
If you start with 100 customers, gain 20 new ones, and end with 110,
CRR = [(110 – 20) ÷ 100] × 100 = 90%
8. Churn Rate
Churn rate measures the percentage of customers who stop using your product: it reflects customer loss and revenue risk.
A good benchmark is below 5% monthly for most SaaS businesses. It is one of the most important early-stage metrics to monitor.
High churn signals issues in product experience, pricing, or expectations. Reducing churn improves revenue predictability and growth efficiency.
Formula:
Churn Rate = (Customers lost during period ÷ Customers at start) × 100
Example:
If you start with 200 customers and lose 20,
Churn rate = (20 ÷ 200) × 100 = 10%
9. Net Revenue Retention (NRR)
Net revenue retention (NRR) measures how much revenue you retain from existing customers, including expansion and churn: it shows true revenue growth from your customer base.
An NRR above 100% is good, while 120%+ is considered excellent. It becomes a key focus in growth and scaling stages.
If NRR is low, focus on upselling and improving retention. It is a critical metric used by investors to evaluate SaaS growth.
Formula:
NRR = [(Starting revenue + Expansion – Churn – Downgrades) ÷ Starting revenue] × 100
Example:
If starting revenue is $50,000, expansion is $10,000, churn is $5,000, and downgrades are $5,000,
NRR = [(50,000 + 10,000 – 5,000 – 5,000) ÷ 50,000] × 100 = 100%
10. Customer Lifetime Value (CLV or LTV)
Customer lifetime value (LTV) estimates the total revenue a customer generates over their lifetime: it helps measure long-term customer value and profitability.
A healthy benchmark is maintaining an LTV that is at least 3x CAC. This metric is important across all stages for profitability insights.
If LTV is low, improve retention or increase pricing. It helps guide how much you can spend on acquisition.
Formula:
LTV = Average revenue per customer × Customer lifespan
Example:
If a customer pays $100/month and stays for 24 months,
LTV = $100 × 24 = $2,400
11. Renewal Rate
Renewal rate measures the percentage of customers who renew their subscriptions: it reflects customer satisfaction and contract continuity.
A strong renewal rate is typically 80–90% or higher. It is especially important for SaaS with annual or long-term contracts.
Low renewal rates indicate gaps in customer success or satisfaction. It helps ensure predictable recurring revenue.
Formula:
Renewal Rate = (Number of renewals ÷ Total customers up for renewal) × 100
Example:
If 80 out of 100 customers renew their subscription,
Renewal rate = (80 ÷ 100) × 100 = 80%
Acquisition and satisfaction metrics
In SaaS (Software as a Service) businesses, acquisition and satisfaction metrics focus on growth efficiency and user experience: they help track how effectively you acquire customers and how satisfied they are with your product.
These SaaS KPIs are essential for improving conversion rates, optimizing marketing spend, and building long-term customer relationships.
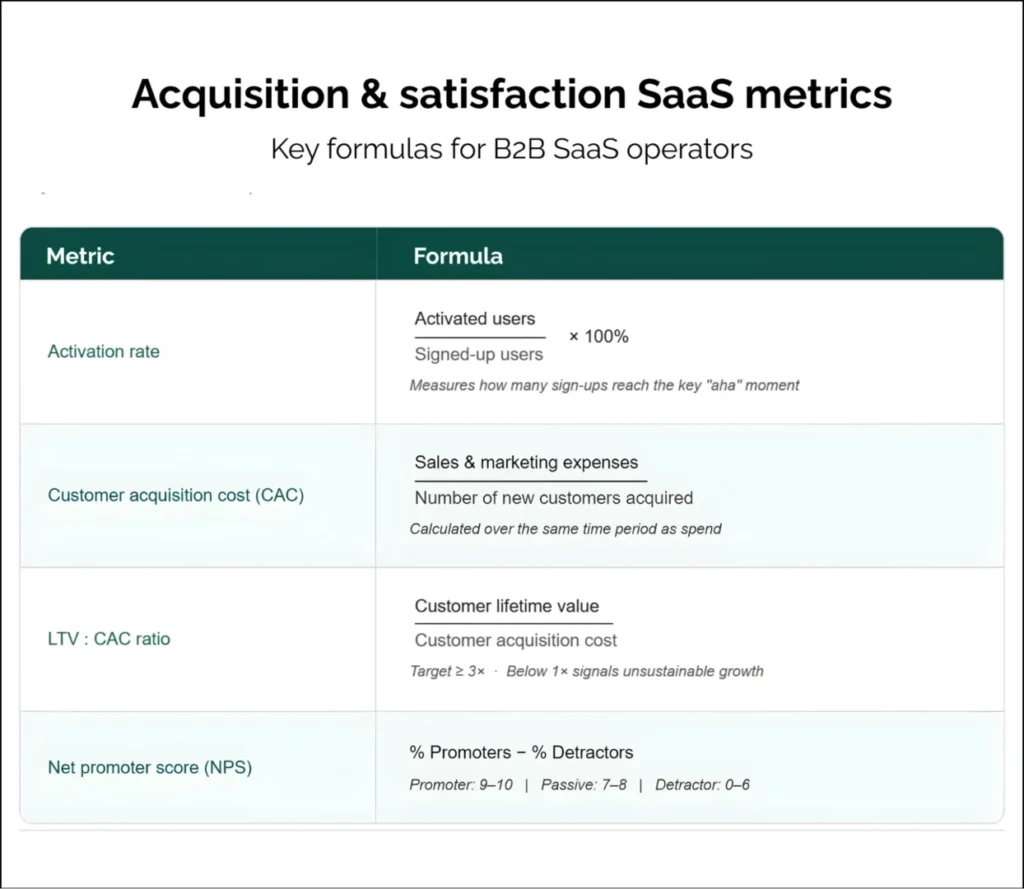
12. Activation Rate
Activation rate measures the percentage of users who complete a key action after signing up: it shows how quickly users experience value from your product.
A common benchmark is 25–40%, depending on product complexity. It is most critical in the early stage of user onboarding.
Low activation suggests friction in onboarding or unclear value delivery. Improving activation increases conversion to paid users.
Formula:
Activation Rate = (Activated users ÷ Total sign-ups) × 100
Example:
If 500 users sign up and 200 complete onboarding,
Activation rate = (200 ÷ 500) × 100 = 40%
13. Customer Acquisition Cost (CAC)
Customer acquisition cost (CAC) measures the total cost of acquiring a new customer: it reflects the efficiency of your marketing and sales efforts, and overall sales process.
CAC should always be evaluated alongside LTV for context. It is important across all stages to track marketing efficiency.
If CAC is high, optimize channels or targeting strategies. It directly impacts profitability and growth efficiency.
Formula:
CAC = Total sales and marketing cost ÷ Number of customers acquired
Example:
If you spend $10,000 on marketing and acquire 100 customers,
CAC = $100
14. LTV: CAC Ratio
The LTV: CAC ratio compares customer lifetime value to acquisition cost: it shows the profitability of your customer acquisition strategy.
An ideal benchmark is 3:1, as widely referenced by companies like Salesforce.
If your ratio is above 5:1, you may be under-investing in growth and can scale faster. If it is below 3:1, you should improve retention or reduce CAC before scaling.
It helps determine whether your growth strategy is sustainable.
Formula:
LTV: CAC Ratio = Customer lifetime value ÷ Customer acquisition cost
Example:
If LTV is $3,000 and CAC is $1,000,
LTV: CAC ratio = 3:1
15. Net Promoter Score (NPS)
Net promoter score (NPS) measures customer satisfaction and loyalty: it shows how likely customers are to recommend your product.
A score above 30 is good, while 50+ is considered excellent. It is relevant across all stages to understand customer sentiment.
Low NPS highlights issues in product experience or support. It helps predict referrals and organic growth potential.
Formula:
NPS = % Promoters – % Detractors
Example:
If 70% are promoters and 20% are detractors,
NPS = 50
This helps you understand overall customer sentiment and brand loyalty, making it easier to identify areas that improve referrals and long-term growth.
What are the additional SaaS metrics to track as you scale?
Scaling requires deeper performance tracking beyond core KPIs: these advanced SaaS metrics help you understand growth efficiency, product usage, and long-term sustainability.
As your SaaS grows, focusing on acquisition efficiency, engagement depth, and unit economics becomes critical for maintaining consistent and profitable growth.
1. Acquisition Efficiency
Acquisition efficiency metrics measure how effectively your funnel converts leads into paying customers: they help optimize marketing performance and sales conversion.
a. Lead-to-customer rate:
Lead-to-customer rate shows the percentage of leads that convert into paying customers: it reflects funnel efficiency and sales effectiveness.
Formula:
Lead-to-Customer Rate = (Customers acquired ÷ Total leads) × 100
Example:
If you generate 1,000 leads and convert 100 into customers,
Lead-to-customer rate = 10%
b. Magic number:
The magic number measures how efficiently your sales and marketing spend generates new revenue: it helps evaluate scalable growth.
Formula:
Magic Number = (Current quarter revenue – Previous quarter revenue) × 4 ÷ Sales & marketing spend
Example:
If revenue grows from $200,000 to $250,000 and spending is $100,000,
Magic number = (50,000 × 4) ÷ 100,000 = 2.0
2. Product Engagement
Product engagement metrics measure how actively users interact with your product: they indicate product stickiness and user behavior.
DAU & MAU:
Daily active users (DAU) and monthly active users (MAU) track how many users engage with your product daily and monthly: they show usage frequency and engagement trends.
Formula:
DAU/MAU Ratio = DAU ÷ MAU
Example:
If DAU = 1,000 and MAU = 5,000,
DAU/MAU ratio = 0.2 (20%)
3. Customer engagement score (CES):
Customer engagement score combines multiple usage signals like logins, feature usage, and activity frequency: it reflects overall product engagement.
Formula:
CES = Weighted score of user actions (logins + feature usage + activity frequency)
Example:
If a user logs in daily, uses key features, and completes actions regularly, they receive a higher engagement score compared to inactive users.
4. Retention Depth
Retention depth measures how deeply users stay engaged over time: it goes beyond basic retention to track usage consistency and feature adoption.
It helps identify power users, expansion opportunities, and long-term product value.
Formula:
Retention Depth = (Active users over time ÷ Total users) × 100
Example:
If 300 out of 1,000 users remain consistently active over time,
Retention depth = 30%
5. Growth Signals
Growth signals track early indicators of SaaS expansion: they help identify whether your business is gaining momentum or slowing down.
These include metrics like product-qualified leads (PQLs), referral growth, and expansion trends.
Formula:
Growth Rate = (Current period value – Previous period value) ÷ Previous period value × 100
Example:
If users grow from 5,000 to 6,000,
Growth rate = 20%
6. Unit Economics & Efficiency
Unit economics metrics measure profitability per customer: they help ensure your SaaS growth is sustainable and efficient.
These metrics focus on balancing revenue, cost, and customer value.
Formula:
Unit Economics = Revenue per customer – Cost per customer
Example:
If revenue per customer is $500 and the cost is $200,
Unit economics = $300 profit per customer
This makes it clear whether your SaaS model is truly profitable at a unit level, helping you scale growth without increasing losses.
How SERP Forge Helps SaaS Brands Turn Metrics into Growth
SaaS metrics are turned into clear growth actions: the focus is on improving revenue and scaling efficiently.
Growth comes from optimizing key areas across the funnel:
- Focus on key metrics: CAC, LTV, churn, and activation rate
- Improve conversions: Reduce acquisition costs and increase efficiency
- Boost retention: Increase LTV through better onboarding and engagement
- Drive expansion: Improve NRR with upsells and deeper usage
- Connect SEO to revenue: Turn traffic into pipeline and MRR
This ensures every metric directly supports growth: not just reporting, but real impact.
Final Thoughts
SaaS metrics are not just numbers to track: they are signals that guide growth, efficiency, and long-term performance.
The real value comes from focusing on the right KPIs and acting on them consistently: this helps improve revenue, reduce churn, and build a scalable business.
When metrics like MRR, CAC, LTV, and retention are aligned with clear strategies, they go beyond reporting: they become the foundation for predictable and sustainable growth.
SaaS Metrics FAQs
1. How do SaaS metrics differ for B2B vs B2C companies?
SaaS metrics differ based on sales cycle, deal size, and customer behavior: B2B focuses on high-value contracts, longer sales cycles, and metrics like ACV, NRR, and sales efficiency. B2C SaaS relies on volume and faster conversions: metrics like activation rate, churn, and user engagement play a bigger role.
2. What are vanity metrics in SaaS and why should you avoid them?
Vanity metrics are numbers that look good but don’t reflect real business impact: they include metrics like total sign-ups, page views, or app downloads without context. These metrics can be misleading because they don’t show revenue, retention, or profitability: focusing on them can lead to poor decisions and wasted resources.
3. How can SaaS teams identify which metric is the most important at each stage?
The most important metric depends on your growth stage: early-stage teams focus on activation and product-market fit, while scaling teams focus on CAC, LTV, and retention. The key is to align metrics with business goals: identify the bottleneck in your funnel and prioritize the metric that directly impacts growth.
4. What tools can help track and visualize SaaS metrics effectively?
SaaS teams use analytics and reporting tools to track performance: platforms like Google Analytics, Mixpanel, Amplitude, and HubSpot help monitor user behavior and conversions. For dashboards and visualization, tools like Tableau and Looker provide clear insights for decision-making.
5. How do SaaS metrics influence investor decisions and valuations?
Investors rely heavily on SaaS metrics to evaluate growth potential and risk: metrics like ARR growth, CAC payback period, LTV: CAC ratio, and churn rate directly impact valuation. Strong metrics indicate predictable revenue and efficient growth: this increases investor confidence and leads to higher valuations.

