
Understanding your SaaS Total Addressable Market (TAM) is critical before investing in growth, fundraising, or product expansion.
A well-defined TAM helps you estimate market potential, validate demand, and identify whether your SaaS idea can scale sustainably.
This complete SaaS TAM guide breaks down how to calculate and validate market size using top-down, bottom-up, and value-based approaches.
You’ll also learn how successful SaaS companies use TAM analysis to refine positioning, prioritize opportunities, and make smarter growth decisions.
What is SaaS TAM?
TAM (Total Addressable Market) is the total revenue opportunity available for your product if you were to capture 100% of the demand in your category.
But in practice, it’s more than just a number; it’s a way to understand the true size, scope, and direction of your business.
At its core, TAM answers a simple but critical question:
“How big can this opportunity realistically become?”
For SaaS businesses, TAM is usually calculated using a few key factors:
- The number of potential customers in your target market
- Your pricing model (monthly or annual subscription)
- Average Revenue Per User (ARPU) or Annual Contract Value (ACV)
- Recurring revenue projections such as MRR and ARR
This gives you a revenue-based view of your market, not just an audience estimate.
Why is the Total Addressable Market Important For Your SaaS?
Understanding the total addressable market (TAM) helps SaaS companies make smarter business decisions early on.
It gives clarity on growth potential, market demand, and whether the business can support a scalable business model in the long run.
Here’s why it matters:
1. Validates Your Idea
If your TAM is too small, even a great product may struggle to scale. A strong TAM supports startup validation and increases confidence that there is enough demand to achieve product-market fit.
2. Attracts Investors
Investors and venture capital firms often evaluate market size before funding a SaaS company. A large and clearly defined market signals stronger growth and long-term exit potential.
3. Guides Product Strategy
Knowing your TAM helps you decide:
- Which features to build
- Which segments to target
- How to position your product
It also helps improve unit economics by focusing on the most profitable customer segments.
4. Aligns Marketing Efforts
TAM helps you focus on audiences that contribute to sustainable growth instead of wasting resources on low-value markets. It also supports better forecasting around customer lifetime value (LTV) and recurring revenue potential.
A large TAM alone isn’t enough. The best SaaS opportunities come from markets that are reachable, validated, and aligned with real customer demand.
According to Fortune Business Insights, the global Software as a Service (SaaS) market size was valued at USD 315.68 billion in 2025 and is projected to grow from USD 375.57 billion in 2026 to USD 1,482.44 billion by 2034.
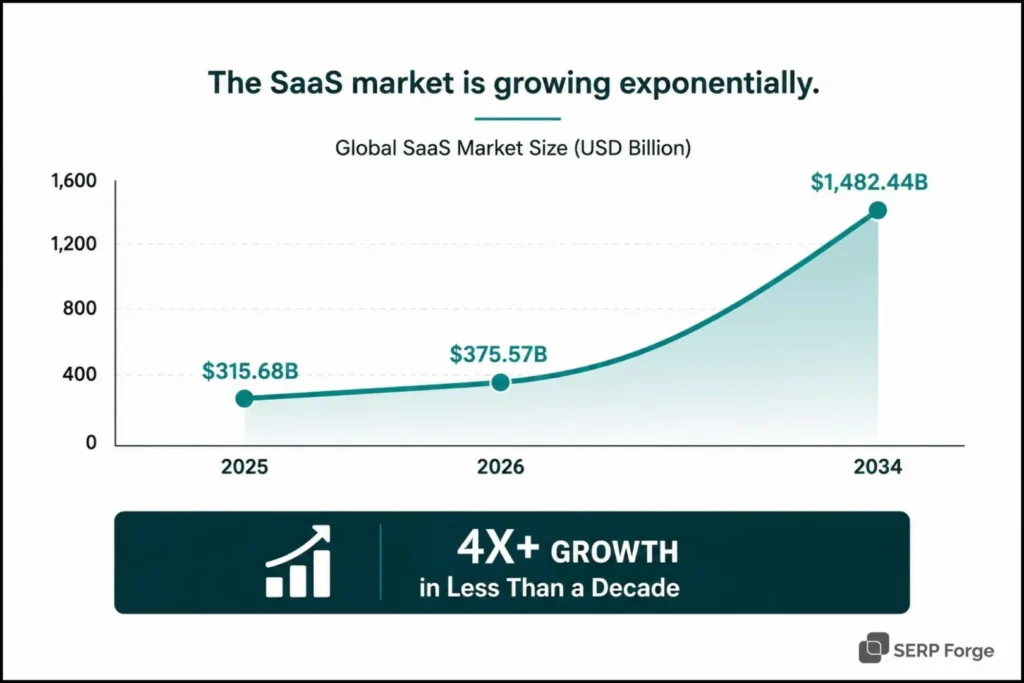
This kind of expansion shows why evaluating your TAM early helps you position your product in a fast-growing space.
SaaS TAM vs SAM vs SOM
These three SaaS metrics are often confused, but each plays a different role in understanding your market and growth potential:
| Comparison Area | TAM (Total Addressable Market) | SAM (Serviceable Available Market) | SOM (Serviceable Obtainable Market) |
|---|---|---|---|
| Meaning | The total market demand for your product category if you captured every possible customer. | The portion of the market your product can realistically serve. | The share of the market you can realistically capture in the near term. |
| Scope | Broadest possible market view. | Narrower and more targeted segment of TAM. | Smallest and most realistic segment. |
| Key Question | How big can this market become? | Which customers can we actually serve? | How much market share can we realistically win? |
| Focus | Long-term growth potential and market size. | Product fit, target audience, and operational reach. | Execution, competition, and achievable revenue goals. |
| Customer Base | All possible customers globally. | Customers that match your product, pricing, geography, and capabilities. | Customers you can realistically acquire with current resources. |
| Depends On | Overall industry demand and market size. | Product limitations, audience fit, pricing, and geographic reach. | Sales capacity, competition, marketing budget, and market penetration. |
| Time Horizon | Long-term vision. | Mid-term strategic planning. | Short-term execution and forecasting. |
| Estimation Style | Often top-down, using industry reports and market research. | Usually filtered using ICPs, customer segments, and operational constraints. | Mostly bottom-up using conversion rates, pipeline capacity, and current traction. |
| Business Use | Investor pitches, market validation, and expansion planning. | Go-to-market strategy, product positioning, and segmentation. | Revenue forecasting, hiring plans, and growth targets. |
| Size Relationship | Largest market estimate. | Subset of TAM. | Subset of SAM. |
How to Identify SaaS Total Addressable Market (TAM) Size?
Identifying your SaaS TAM isn’t about pulling a big number from a report; it’s about building a defensible view of your market using real signals. The most reliable TAM comes from combining customer understanding, data-backed estimation, and continuous validation.
Think of it as a layered process: you start with who your ideal users are, quantify the opportunity, validate if demand actually exists, and then refine it as your business grows.
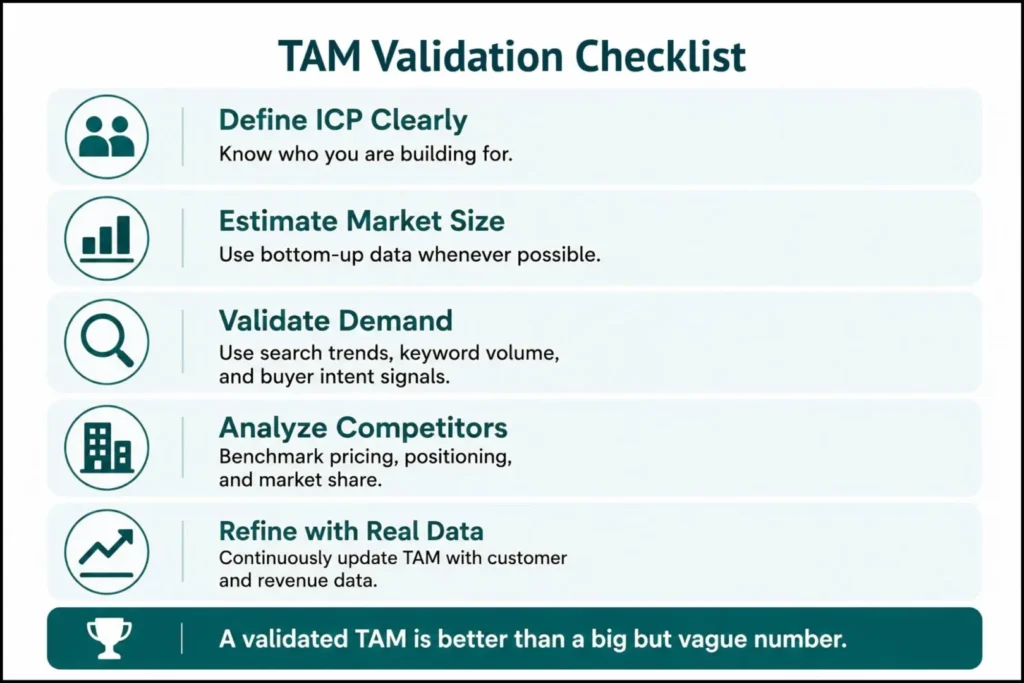
Define Your Ideal Customer Segments (ICP)
Everything starts with clarity on who you are building for. Your TAM is only as accurate as your understanding of your ideal customer.
Instead of defining your ICP too broadly (for example, “small businesses”), build a detailed buyer persona through proper customer segmentation.
Go deeper into factors like:
- Industry (e.g., SaaS, agencies, eCommerce)
- Business type, such as SMB SaaS, mid-market SaaS, or enterprise SaaS
- Product category, including vertical SaaS or horizontal SaaS
- Company size (team size or revenue range)
- Use case (the specific problem they want to solve)
- Buying triggers (when they actively search for a solution)
A strong ICP does two important things:
- Narrows your TAM into a more realistic market segment
- Prevents overestimation by removing irrelevant audiences
Treat ICP as a filter, not just a definition. The sharper your customer segmentation, the more actionable and accurate your TAM becomes.
Estimate Market Size Using Bottom-Up Data
Once your ICP is defined, move to quantification using real-world inputs. This is where bottom-up estimation becomes critical.
Start with:
- Number of potential customers in your ICP
- Average pricing (monthly or annual)
- Expected adoption rate (optional but useful)
For example:
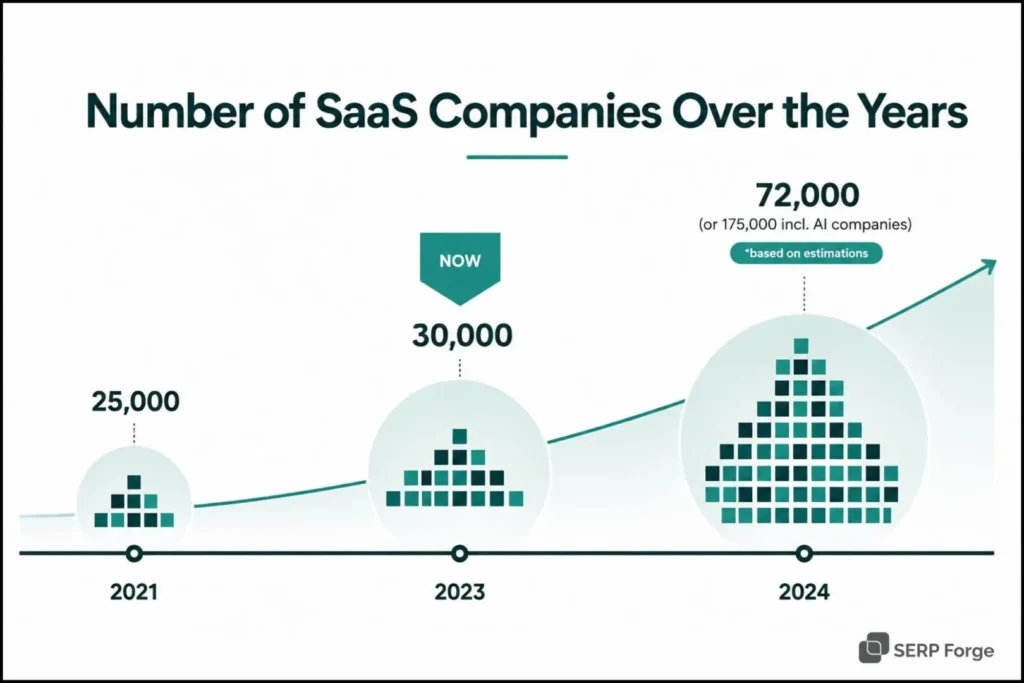
If 25,000 companies match your ICP and your average pricing is $50/month, your TAM becomes grounded in reality, not assumptions.
Bottom-up TAM reflects actual buying capacity, not theoretical market size. It’s the most trusted method among operators and investors.
Once you have your bottom-up number, your value based pricing strategy directly influences your ACV and how much of that market you can realistically capture.
Validate Demand with Search and Buyer Intent Signals
A market isn’t real unless people are actively looking for solutions. This is where demand validation comes in.
Look for:
- Search volume around problem-aware and solution-aware keywords
- “Best tools,” “alternatives,” and “pricing” queries (high intent)
- Paid ads from competitors (indicates monetizable demand)
Search behavior reveals:
- Whether your problem is recognized
- How mature the market is
- What language does your audience use
Search data is not just for SEO; it’s a live proxy for TAM validation. If demand is weak, your TAM may exist on paper but not in reality.
It’s estimated that 85% of business applications will be SaaS-based, which clearly indicates a strong shift toward cloud-based solutions. This kind of adoption trend validates that demand exists and continues to grow across industries.
Benchmark Against Competitors and Industry Data
Your TAM should align with what’s already happening in the market.
Analyze:
- Competitor pricing and positioning
- Estimated customer base or traffic
- Funding and growth signals
- Industry reports and benchmarks
This helps you:
- Validate whether your estimates are realistic
- Identify gaps or underserved segments
- Avoid overestimating market potential
Don’t just copy competitor numbers. Use them as reference points, not final answers.
Refine TAM Using Real Customer and Revenue Data
Your TAM should evolve as your business grows. Early estimates are directional, but real data makes them sharper.
Track metrics such as:
- Customer acquisition trends across different segments
- Revenue per customer or segment
- Retention metrics like churn rate and net revenue retention (NRR)
- Expansion revenue from upsells and account growth
Over time, this data helps you identify:
- Which customer segments convert best
- Which use cases generate stronger revenue expansion
- Where new market opportunities exist
TAM is not static; it’s a living model. The more data you collect, the more precise and actionable it becomes.
How to Calculate SaaS TAM?
Calculating SaaS TAM is not just about applying a formula; it’s about choosing the right method based on the stage of your product, data availability, and market clarity.
At a deeper level, TAM calculation is about translating market demand, pricing power, and customer segments into a measurable revenue opportunity. Let’s break down the three core approaches.
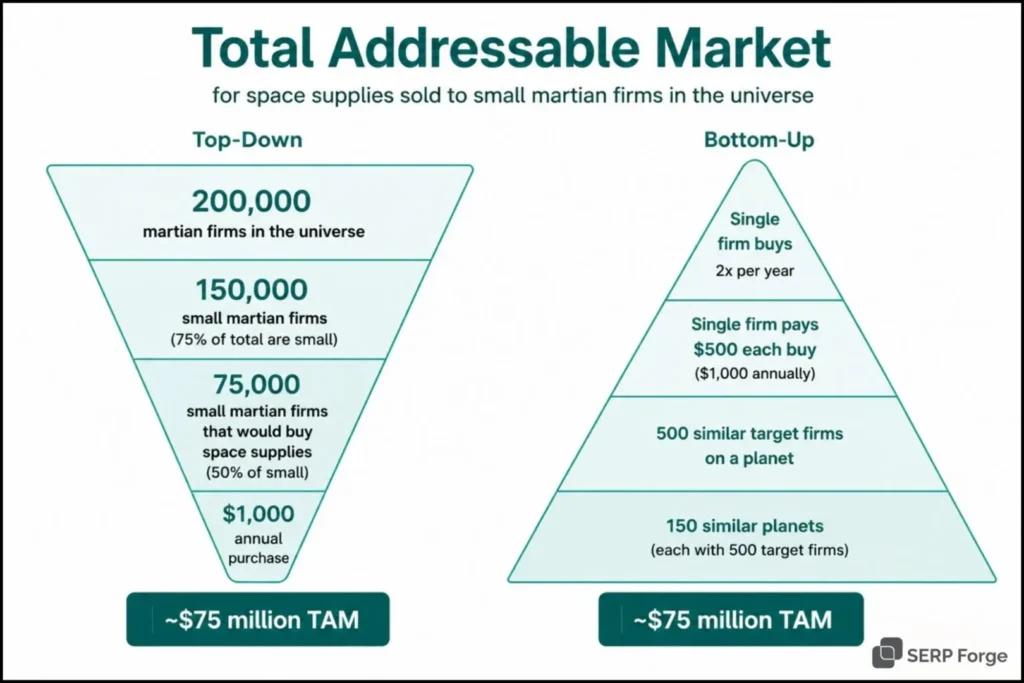
Top-Down TAM Calculation
Top-down TAM starts with a broad market estimate from industry research or analyst reports and narrows it down to your segment.
Formula:
Total market size × your addressable percentage
Example:
The global project management software market is worth $6B. Your product targets SaaS companies, which make up around 12% of that market.
Your TAM = $6B × 12% = $720M
This method is useful for understanding macro market trends and high-level market forecasting. However, it can become inaccurate if the reports are outdated or too broad. Use top-down TAM as a directional benchmark, not your primary calculation model.
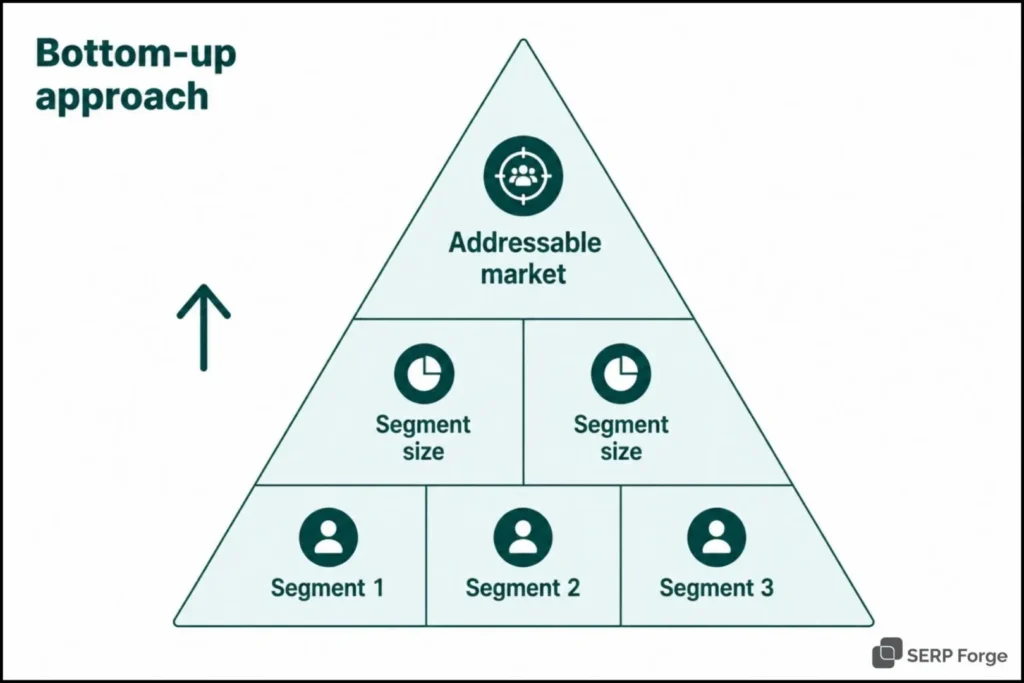
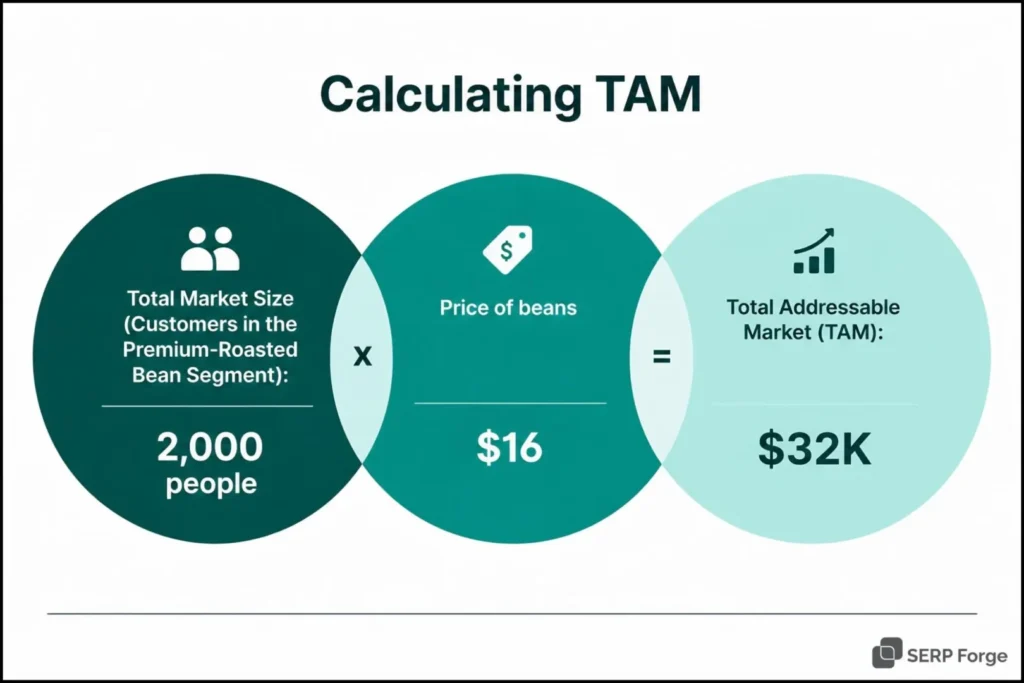
Bottom-Up TAM Calculation
Bottom-up TAM is more practical because it starts with your actual target customers and pricing.
Formula:
Number of ICP companies × ACV
Example:
120,000 B2B SaaS companies × $1,800 ACV = $216M TAM
This method uses ICP-based estimation, making it more actionable for SaaS companies. It also aligns closely with your sales pipeline, pricing strategy, customer acquisition cost (CAC), and average revenue per account.
Because it is based on observable customer data, bottom-up TAM is often considered more reliable by investors and operators. To refine this further, understanding your buyers’ actual take-home pay matters especially for prosumer or SMB-facing SaaS. Use our annual income calculator to benchmark net annual income across your target segments.
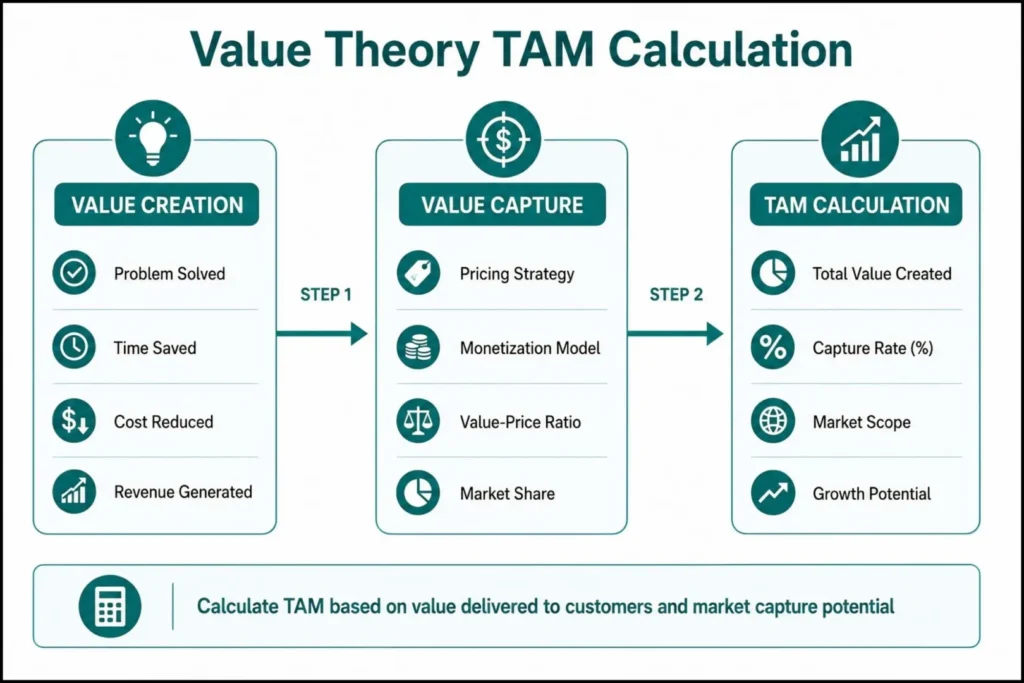
Value-Theory TAM Approach
The value-theory method estimates TAM based on the business value your product creates instead of competitor pricing.
Formula:
Value created per customer × number of customers
Example:
If your SaaS reduces churn by 2% and saves a company $50,000 annually, you may use value-based pricing and charge $5,000 per year. With 40,000 target companies, your TAM becomes $200M.
This approach works well for category creation, especially when there are no direct competitors or pricing benchmarks. It also supports ROI-driven pricing by tying your pricing directly to measurable economic impact.
What are the Best SaaS TAM Examples?
Studying how successful SaaS companies framed their TAM reveals patterns worth replicating:
- Salesforce: Salesforce based its TAM on the global CRM software market, which was estimated at around $4B at the time. Over the years, the company expanded beyond CRM through acquisitions, new products, and ecosystem growth.
- Slack: Slack estimated its TAM using global spending on communication and collaboration tools. At the time, the platform had more than 10 million daily active users, showing strong market demand for workplace communication software.
- Notion: Notion focused on the large global base of knowledge workers and built a flexible product for a broad audience. This approach helped position the company within a massive long-term market opportunity.
The common thread across these examples is that the most defensible TAMs combine a bottom-up ICP-based calculation with top-down market validation and tie the number directly to the product’s pricing model.
Where Do Founders Go Wrong with SaaS TAM?
Many founders miscalculate the SaaS TAM, leading to poor strategic decisions, misaligned go-to-market plans, and unrealistic growth expectations.
The issue isn’t just the number, it’s how that number is derived and interpreted within the context of real market demand.
1. Overestimating Market Size
A common mistake is relying on broad industry reports to define saas market size instead of using actual customer-level data. This inflates TAM and creates a false sense of opportunity without reflecting real buying behavior or accessible segments.
2. Ignoring ICP Clarity
Trying to target “everyone” weakens your TAM accuracy. Without a clearly defined Ideal Customer Profile (ICP), your total addressable market saas becomes too generic and disconnected from real users who are likely to convert.
3. Relying Only on Top-Down Data
Top-down estimates often look impressive but lack grounding in reality. Depending only on this approach leads to inflated projections that don’t align with actual market penetration or achievable revenue.
4. Not Validating Demand
A large TAM doesn’t guarantee demand. If users aren’t actively searching, comparing, or buying solutions, your TAM in saas exists only on paper. Demand signals like search intent, product adoption, and willingness to pay are critical.
5. Ignoring Competition
Even in a large market, strong competition reduces your serviceable obtainable market (SOM). High TAM does not mean easy entry; it often means crowded space, higher customer acquisition costs, and longer sales cycles.
A smaller, well-defined TAM with strong demand, clear positioning, and validated customer intent is far more valuable than a large, vague market with no clear path to revenue.
What is the Role of SaaS TAM in SEO Planning?
SaaS TAM is not just a financial metric; it is a powerful input for content strategy and SEO planning. Understanding your total addressable market tells you exactly who is searching for solutions like yours, what language they use, and where they are in the buying journey.
TAM segmentation maps directly to keyword clustering. If your TAM includes three distinct ICP segments: PLG startups, growth-stage SaaS, and enterprise SaaS, each segment uses a different search language, reads different publications, and responds to different content formats.
This is exactly where SERP Forge becomes valuable. SERP Forge integrates TAM-driven ICP data with keyword difficulty analysis, letting you identify which segments of your total addressable market are actively searching for solutions and where your content has the highest probability of ranking.
Conclusion
Understanding SaaS TAM is not just about numbers; it’s about clarity. It helps you validate your idea, focus on the right audience, build a realistic growth strategy, and align your SEO and marketing efforts with actual demand.
The key is to stay practical, use bottom-up calculations for accuracy, validate demand early through real signals, and continuously refine your assumptions as you gather more data. When done right, TAM becomes your roadmap for growth, not just another metric on paper.
SaaS TAM FAQs
1. What is SaaS TAM in simple terms?
SaaS TAM is the total revenue opportunity available if your product captures 100% of the market demand.
2. How do you calculate the SaaS total addressable market?
You calculate it using three methods: the top-down approach (starting from industry data), the bottom-up approach (using actual customer numbers and pricing, most accurate), and the value-based approach (based on the value your product delivers).
3. Why is TAM important for SaaS startups?
It helps validate your idea, attract investors, and guide your product, pricing, and marketing decisions.
4. What is the difference between TAM, SAM, and SOM?
TAM is the total market, SAM is your target segment, and SOM is the realistic share you can capture.
5. What is a good TAM for a SaaS business?
$10M–$50M is a small niche, $100M+ is a strong opportunity, and $1B+ indicates high growth potential.

