


Three months in, the client asks where the rankings are. You have built 18 links. The report shows DR scores and anchor text. Nobody in the room cares.
38% of marketers cite page rankings as their top KPI for link building. Rankings are also the first thing missing from most reports they send clients. The math does not work in your favour when the report is just a URL list.
A consistent SEO link building report records activity and much more. It gives leadership visibility, surfaces problems early and connects link building directly to rankings and revenue.
This guide covers what to include, which metrics matter, how to build the report step by step, three ready-to-use templates and the five mistakes that quietly end retainers.
What is a Link Building Report?
A link building report is a document that tracks backlinks acquired during a specific period and connects them to ranking, traffic and campaign goals.
The goal is to go from “here is what we built” to “here is what it did.” In a format a non-SEO founder can read on a Friday afternoon and feel good about the budget.
Why Is Link Building Reporting Important?
Links take time to move rankings. Clients feel that delay more than you do.
Without a consistent report, there is no way to distinguish between “working, just inside the normal 3-to-6 month window” and “producing nothing.” Most stakeholders assume the second interpretation when evidence is thin.
Good reporting changes that dynamic. Here is what a solid report does for your program:
- Gives leadership visibility before they start asking questions
- Surfaces lost links and dropping referring domains early, before rankings follow
- Connects link activity to page-level ranking and traffic changes
- Builds the renewal case before renewal season arrives
The top-ranking page on Google has 3.8x more backlinks than pages ranked two through ten. A report is how you show that gap closing month by month.
What to Include in a Link Building Report?
A complete report has eight sections. Each one serves a specific purpose; skip any of them and the story has a hole in it.
1. Executive Summary
Write this last, after all the data is in.
Five to seven lines. Cover links acquired, referring domains added, any ranking movements on priority pages, one key win and one item to watch. A non-SEO stakeholder should read this section and know exactly where things stand.
2. Links Acquired
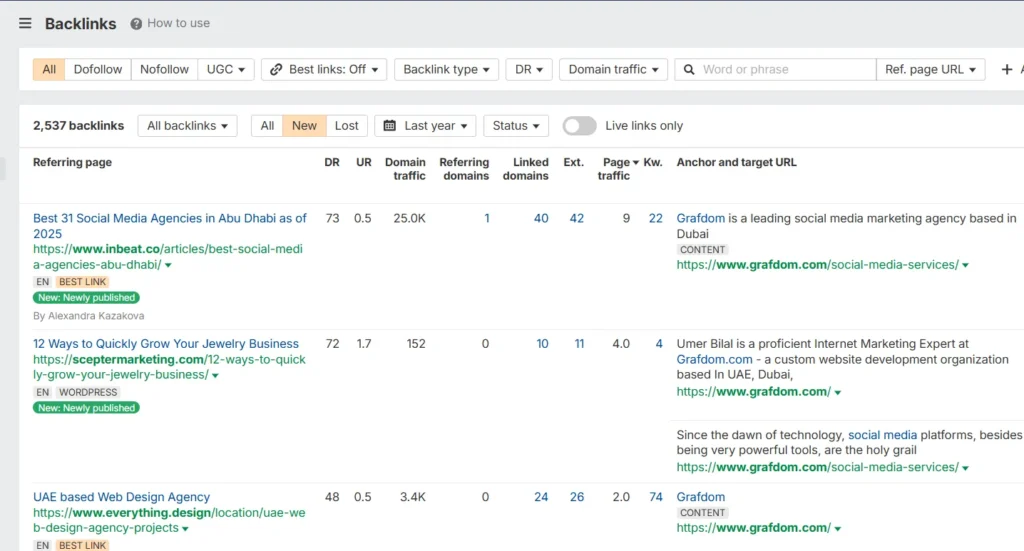
Every link placed during the period belongs here, with enough context to show quality at a glance. Record the following for each placement:
| Field | What to Record |
|---|---|
| Target URL | Record the page or URL that received the backlink. |
| Referring Page URL | Track the exact page where the backlink is placed. |
| DR of Referring Domain | Capture the domain rating as a quality and authority signal. |
| Anchor Text | Monitor anchor text usage to maintain a healthy distribution profile. |
| Link Type | Specify whether the link is dofollow or nofollow. |
| Date Live | Record the publication date for backlink velocity and tracking purposes. |
Fifty links with no context looks worse than ten links with quality signals and target page mapping attached.
3. Referring Domains
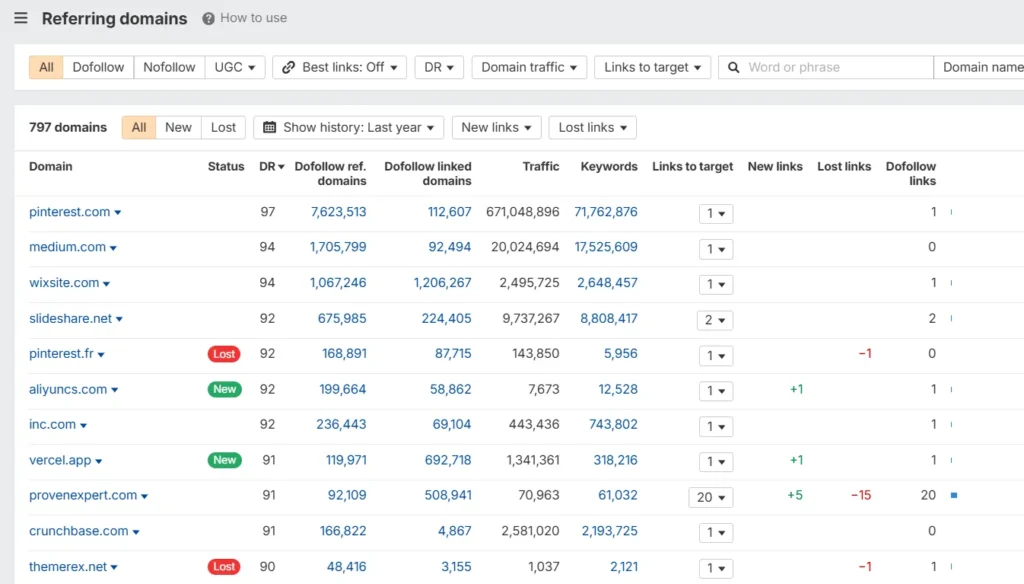
Track unique referring domains separately from total backlink count. One domain sending ten links counts as one here.
Pages with diverse referring domain profiles consistently outperform those with high link counts from a narrow set of sources. Show it as a month-on-month trend.
4. Anchor Text Distribution
Over-optimised exact match anchors are a risk signal for your backlink profile. Branded anchors should make up 40 to 50 percent of your total distribution and are the safest anchor type to build at scale. A natural distribution looks roughly like this:
| Anchor Type | Healthy Range |
|---|---|
| Branded | 40%–50% |
| Naked URL | 20%–30% |
| Generic (e.g., “click here”, “read more”) | 10%–15% |
| Partial Match | 10%–15% |
| Exact Match Keyword | Under 5% |
5. Domain Authority and Link Quality
DR and DA are fast quality signals. They are not the whole picture.
Also check topical relevance, placement in body content vs sidebar and organic traffic of the referring page. Links also pass link equity; the authority value transferred from the referring page to your target URL.
A DR 60 link from a relevant, well-trafficked page beats a DR 80 footer link on an unrelated site.
Before any link enters the report, run it through a link quality assessment.
Check four things: link relevance to the target page topic, placement in body content vs sidebar, organic traffic of the referring page and link attribute.
A placement that fails two or more of these four checks should not appear in the wins column regardless of DR.
6. Organic Traffic and Rankings Impact
This section is what saves retainers. Map each target page’s link activity to its ranking and traffic change. The format below makes that connection visible at a glance:
| Target Page | Keyword | Last Month | This Month | Traffic Change |
|---|---|---|---|---|
| /blog/saas-sales-funnel | saas sales funnel | 14 | 7 | +340 visits |
| /pricing | crm software pricing | 22 | 18 | +90 visits |
Some links will show no visible movement in the reporting window. Say that directly, with a timeline expectation attached.
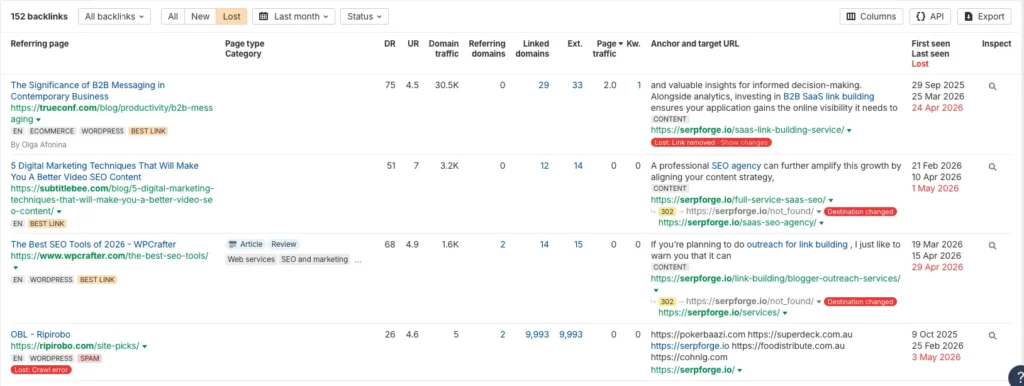
7. Lost Links
Every competitor article reviewed for this guide skips this section entirely.
Lost links silently undo the progress new links are building. A net gain of ten new links means nothing if fifteen DR 70+ referring domains dropped in the same period. Record the following for each lost link:
Do not disavow links by default. Consider disavow only when there is clear evidence of unnatural links, a manual action risk, or a spam attack reviewed by your SEO lead.
Run toxic and spam link monitoring monthly alongside the lost links pull. Flag any referring domain showing sudden DR spikes, a majority of backlinks from unrelated foreign-language sites or known PBN signals.
Log flagged domains in a separate tab and review each one before making a disavow decision. Disavow is a last resort, it’s not a default response to low-quality links.
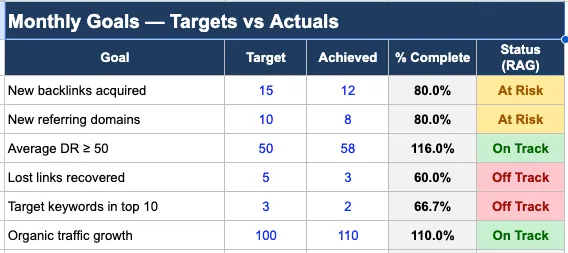
8. Campaign Progress vs Goals
Close every report with a verdict on the goals set at the start of the period. Use a RAG status so the result reads in seconds:
| Goal | Target | Achieved | Status |
|---|---|---|---|
| New Referring Domains | 15 | 12 | On Track |
| DR 50+ Links | 8 | 8 | Met |
| Primary Keyword Top 10 | Top 10 | Position 11 | Needs Attention |
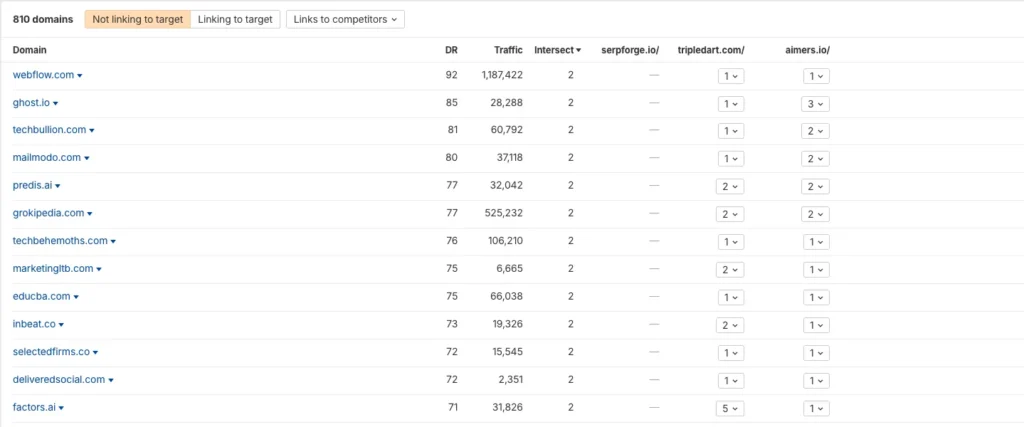
9. Competitor Backlink Comparison
Close the report with a competitor backlink comparison alongside the goals tracker. Pull referring domain counts for the top two ranking competitors on each priority keyword and show the gap month on month:
| Page | Your Referring Domains | Competitor Referring Domains | Gap |
|---|---|---|---|
| /pricing | 18 | 34 | 16 |
| /blog/saas-seo | 11 | 27 | 16 |
Include domain authority comparisons alongside referring domain counts. A shrinking gap across both metrics is the clearest early signal that the campaign is working, even before rankings move.
What Metrics Should You Track in a Link Building Report?
Most link building tools surface dozens of metrics. These six are the ones that actually tell you whether the program is working.
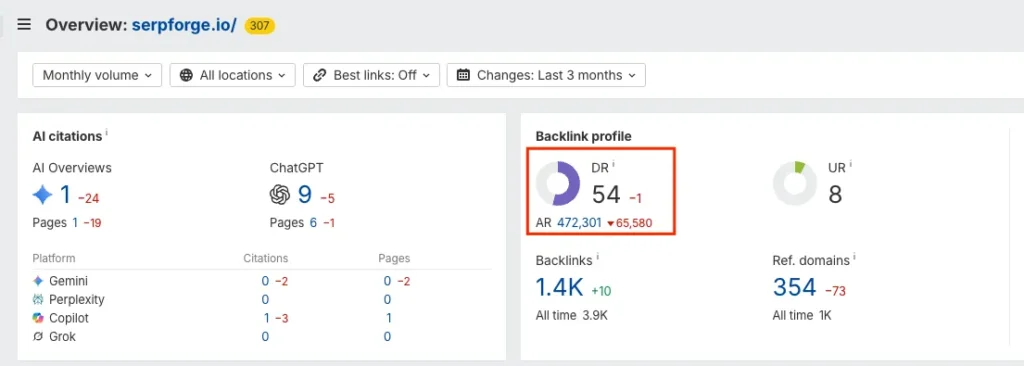
1. Domain Rating and Domain Authority
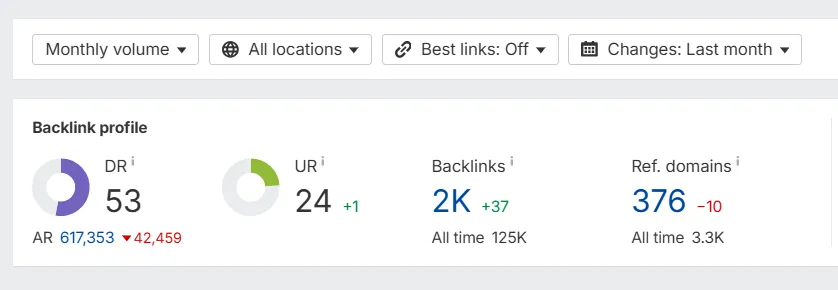
DR (Ahrefs) and DA (Moz) measure the authority of a referring domain’s backlink profile. Pick one and use it across every report.
Switching tools mid-campaign creates false trend lines that confuse everyone reading the data.
DR 50+ is a reasonable quality floor for most campaigns. Anything below 30 needs strong topical relevance to justify including it.
2. Referring Domains Growth
A steady upward curve month over month signals a healthy, sustainable program. A spike followed by a flat line usually means a burst campaign ran without a follow-up strategy.
Track the link-building trend, not just the current total.
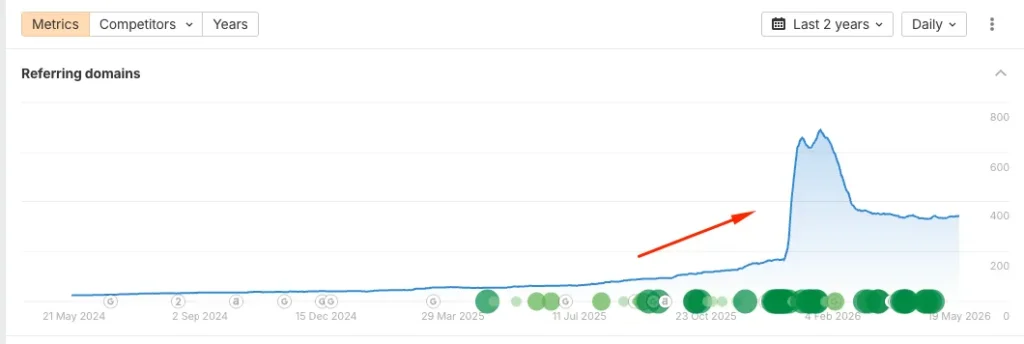
3. Link Velocity
Link velocity, also called backlink velocity, is the rate at which new referring domains arrive over time. Too fast looks unnatural to search engines. Too slow means campaign stalls are not being caught early.
Ten to twenty new referring domains per month is a healthy baseline for most mid-market B2B or SaaS sites. Adjust based on competitive gap analysis in Ahrefs Site Explorer.
4. Organic Keyword Rankings
Track the specific keyword tied to each target page receiving links. Sitewide ranking averages tell you nothing about which links worked.
One page, one keyword, one trend line. That is the resolution that makes link building impact visible.
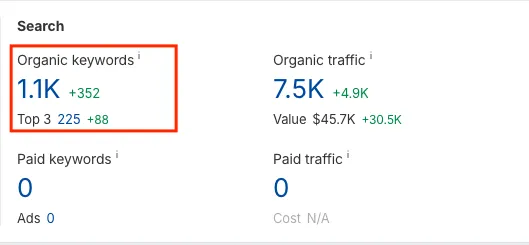
5. Organic Traffic from Target Pages
Rankings move, but traffic is what leadership measures. Ranking improvements translate directly to organic search visibility gains on target pages.
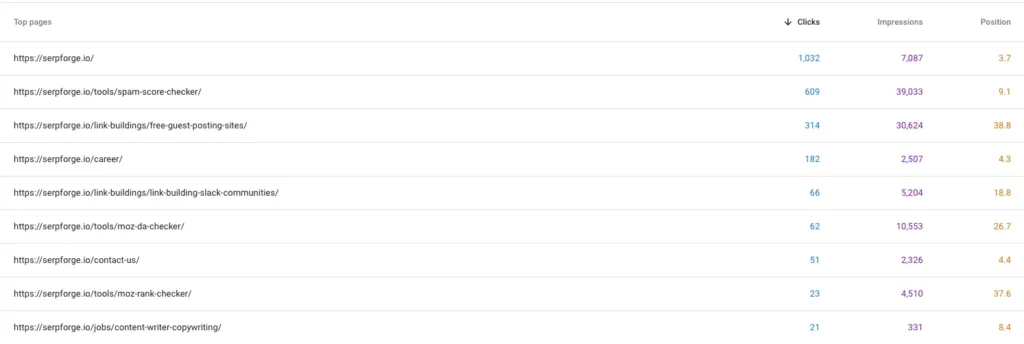
Pull organic traffic per target page directly from Google Search Console. GSC is the most accurate source for organic click data and free.
5. Link Type Breakdown
A backlink profile made entirely of guest post links is a risk flag. Report the mix across every period to show the link building strategy is intentional and varied:
- Guest posts
- Niche edits and link insertions
- Digital PR placements
- Resource page links
- Unlinked brand mention conversions
Show each type as a percentage of total links acquired.
6. Outreach Campaign Metrics
Track these alongside backlink data every month to know where the campaign is leaking:
| Metric | What It Shows |
|---|---|
| Emails Sent | Total outreach volume across campaigns. |
| Reply Rate | Indicates the effectiveness of targeting, personalization, and outreach copy. |
| Placement Rate | Shows the percentage of replies that resulted in live backlinks or placements. |
| Outreach-to-Placement Time | Measures how long it takes for a link opportunity to move from outreach to confirmation. |
A placement rate below 10% on a vetted list is a copy problem. A high reply rate with a low placement rate is a vetting problem.
7. KPI Benchmark
Every metric needs a reference point. Use these baselines for a mid-market B2B or SaaS campaign:
| Metric | Benchmark |
|---|---|
| New Referring Domains per Month | 10–20 |
| Average DR of New Links | 40–60 |
| Reply Rate | 8%–15% |
| Placement Rate | 20%–35% |
| Ranking Movement Window | 3–6 months |
Flag anything outside its range and add one line of context.
How to Build a Link Building Report Step by Step
A repeatable link building reporting process takes less than an hour once it is set up. Here is the full workflow from blank doc to client-ready output.
Step 1: Set the Reporting Period and Goals
Before building your link building process report, confirm the reporting period and document which outreach campaigns ran during it. Campaigns without a reporting period attached cannot be evaluated at month end.
At the start of each period, document the goals in writing: how many new referring domains are targeted, which pages are priority targets, what DR floor applies. Goals set upfront mean the report writes itself at month end.
Step 2: Pull Data from Your Tools
Use one primary tool and stay consistent every month. From Ahrefs or Semrush, pull:
- New backlinks acquired in the period
- Lost backlinks in the period
- Referring domain growth trend
- Anchor text distribution
- DR of all new referring domains
Cross-reference with Google Search Console for organic traffic and ranking data on each target page.
Step 3: Organise Links by Quality and Type
Sort acquired links into the SERP Forge Link Quality Tiers before writing anything. Leading with quality means the executive summary lands before anyone digs into the full data:
- Tier 1: DR 60+, topically relevant, body content placement
- Tier 2: DR 30–60, relevant, body content
- Tier 3: DR under 30 or weak topical fit
Push Tier 3 to an appendix. Quality should land before volume in every report a client reads.
Step 4: Map Links to Ranking and Traffic Changes
For each high-value link acquired, check whether the target page moved in rankings within 30 to 90 days. If it moved, note the link as a contributing factor.
If rankings stayed flat, explain why. New pages take longer. Dense competition or thin link volume on that page are the usual reasons.
HubSpot’s SEO reporting research confirms that connecting channel activity to page-level outcomes is the biggest single trust-builder in client-facing reports.
Step 5: Add Context After Every Data Section
Raw numbers without interpretation read as noise to anyone outside SEO. After each data section, add a short plain-language summary using this structure:
- What happened: 12 new referring domains added, up from 8 last month
- What it means: Link velocity is accelerating. The /pricing page is the main beneficiary
- What comes next: Two DR 70+ placements confirmed for next month on the same page
Step 6: Format for the Reader
The same data needs different packaging depending on who opens the report. Match the format to the audience before you open the template:
| Audience | Format Priority |
|---|---|
| Non-SEO Client | Executive summary first, plain language explanations, ranking snapshots, and a clear overall verdict. |
| In-house SEO Lead | Detailed metrics, anchor text distribution, lost links analysis, and competitive context. |
| Agency Leadership | Pipeline status, cost per link, campaign ROI, and a forward-looking 30-day action plan. |
Step 7: Reporting When Results Are Still Early
This step does not appear in any competitor guide and it is the most important one for keeping clients past month three.
In months one and two, links have not had enough time to shift rankings. Ahrefs research shows it typically takes 3 to 6 months for new links to produce measurable ranking movement.
Clients who ask about results in month two need a different answer than a ranking table they cannot yet interpret.
Show these in early-stage reports instead:
- Activity proof: links placed, DR of referring domains, anchor text used
- Leading indicators: referring domain growth trend, crawl frequency increase on target pages
- Competitive context: how many referring domains competitors have versus your current count
- Expectation anchor: the 3-to-6 month timeline, stated directly, every month until results arrive
Set it in month one. Repeat it in month two. By month four, the data handles itself.
A SaaS client in month two asked why rankings had moved after eight links were placed. The report showed referring domain growth from 0 to 8, a 22% crawl frequency increase on the target page and a competitive gap of 34 referring domains against the top-ranking competitor.
The conversation shifted from “is this working” to “how many more links do we need.” That is what early-stage reporting is for.
SERP Forge Benchmark: Campaigns that set timeline expectations in month one and repeat them monthly retain clients through the 3-to-6 month results gap significantly more often than those that don’t. Source: SERP Forge internal data, 2025.
Link Building Dashboard Template (Free Google Sheets)
The SERP Forge Link Building Report Template is built in Google Sheets with eight tabs. Each tab handles one part of the report so data stays organised and the monthly update takes under an hour.
Here is what each tab does and what to fill in:
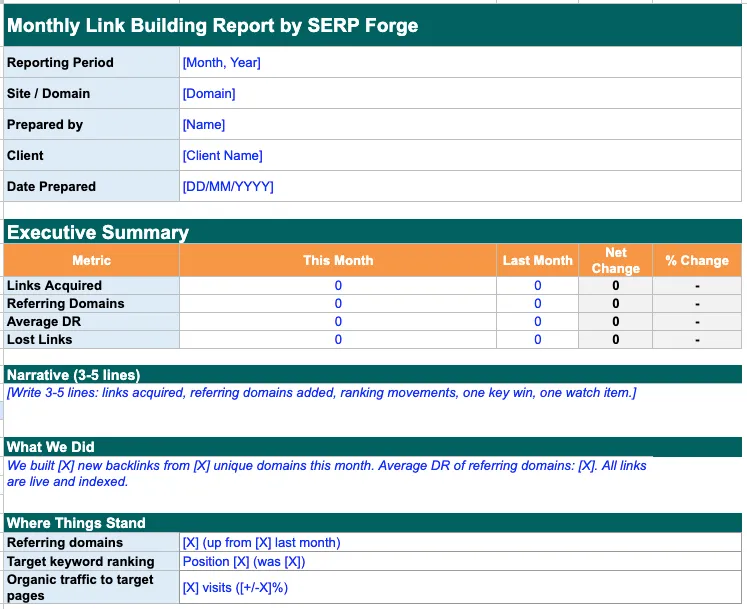
Tab 1: Executive Summary
Opens with reporting period, domain and preparer name. Fill this last. Summarise links acquired, referring domains added, one key win and one item to watch. Five lines maximum.
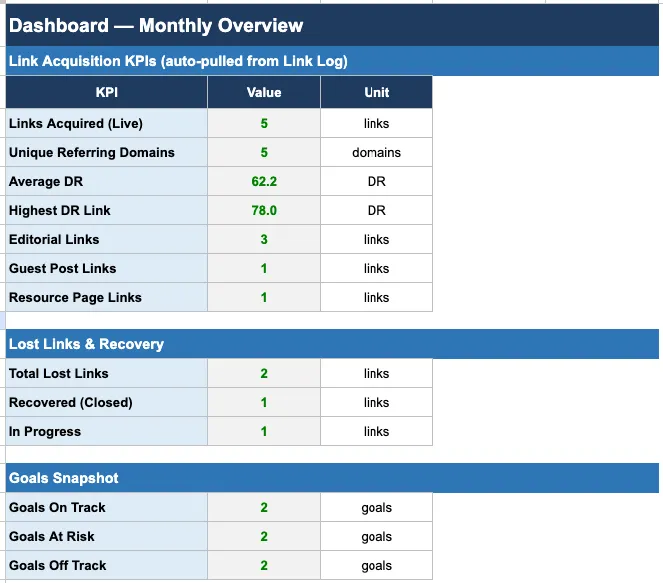
Tab 2: Overview
A dashboard that auto-pulls live link count and unique referring domains directly from the Link Log using formulas. No manual input needed once the Link Log is updated.
Tab 3: Link Log
The master record for every link placed. Columns cover date live, target page, referring domain, DR, anchor text, link type and status. Update this first every month. Everything else in the sheet pulls from here.
Tab 4: Links (Lost Links Log)
Tracks every lost link with date, referring domain, DR, recovery status and action taken. Update alongside the Link Log each month.
Tab 5: Rankings
Tracks keyword positions week by week for each target page. Four weekly columns plus a month average formula. Pull data from Ahrefs Rank Tracker or Google Search Console.
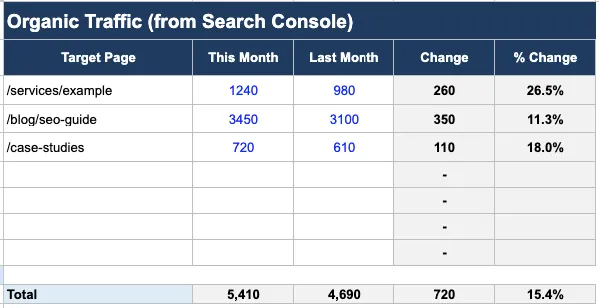
Tab 6: Traffic
Pulls organic traffic per target page for this month and last month. Change and percentage change calculate automatically. Source data from Google Search Console.
Tab 7: Goals
Lists monthly targets against actuals with a RAG status that calculates automatically. On Track, At Risk or Off Track based on percentage complete. No manual status updates needed.
Tab 8: Next Priorities
Three bullet slots for what to focus on next month. Confirmed placements, recovery actions and content priorities go here.

Which Tools Are Best for Link Building Reporting?
The right tool stack depends on your budget and team size. Here are the five options worth knowing ranked from most comprehensive to leanest:
1. Ahrefs
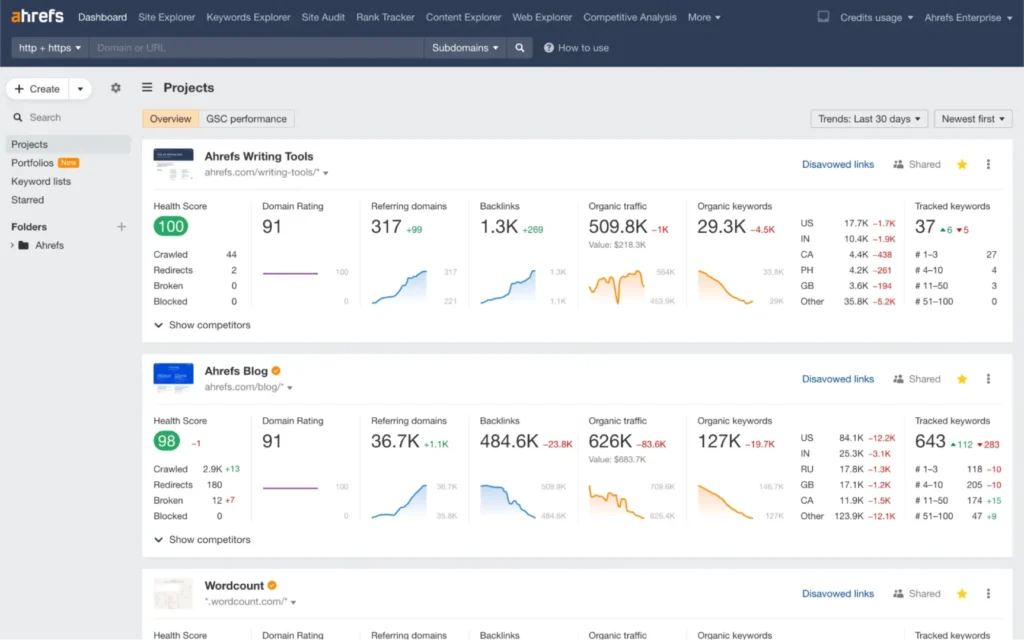
Ahrefs is the standard for backlink data. Site Explorer pulls new and lost links, referring domain trends, anchor text distribution and DR. These are all filterable by date, link type and DR range.
The Backlinks report exports to CSV in seconds. Drop it into the link log tab and the monthly data pull takes about 20 minutes.
Best for: Backlink data, lost link tracking, competitor gap analysis.
2. Semrush
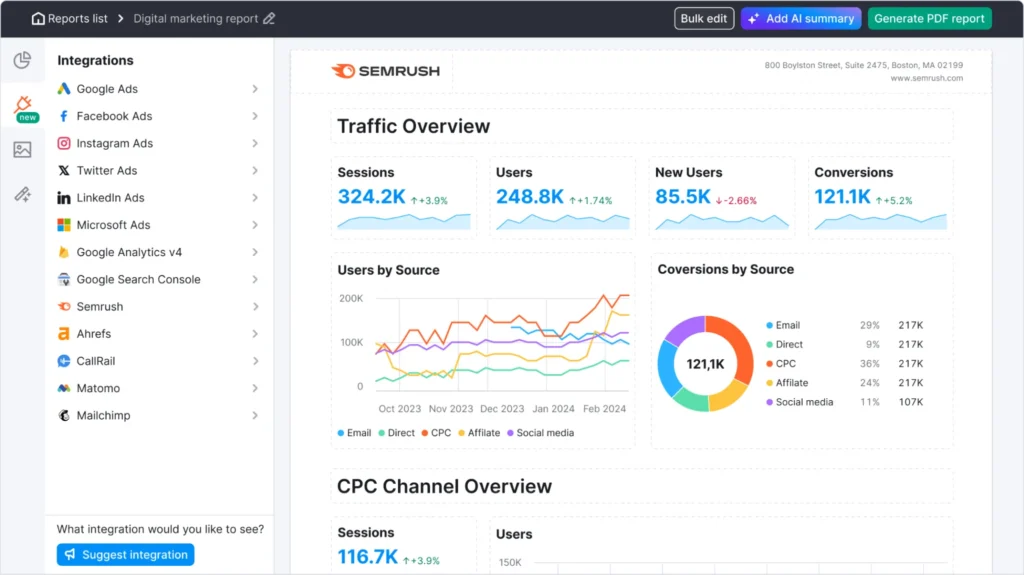
Semrush’s Backlink Analytics covers full profile visibility, Authority Score benchmarking and an anchor text breakdown that exports directly for report use.
The referring domain overlap view against competitors is especially useful in early-stage reports when you need to show context before ranking results appear.
Best for: Anchor text analysis, competitive gap reports, Authority Score tracking.
3. Moz
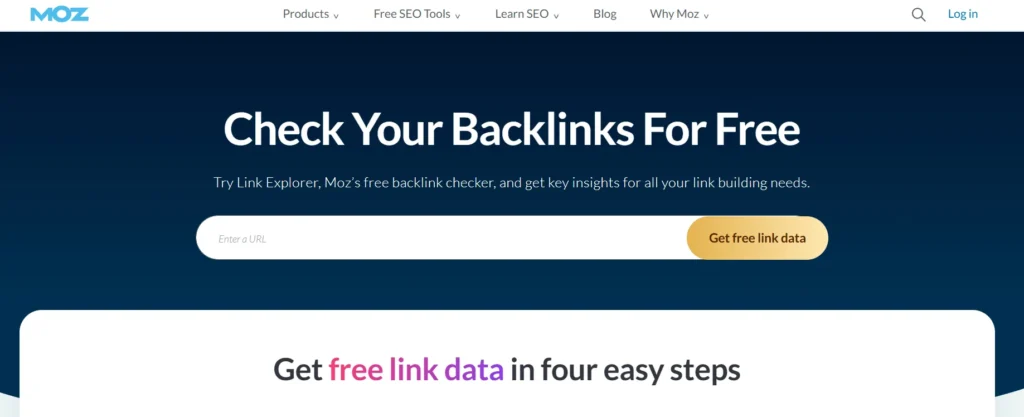
Moz’s Link Explorer surfaces Domain Authority and spam score per referring domain. DA is widely understood by non-SEO clients, which makes it the more practical metric for client-facing quality sections.
Best for: Client-facing quality metrics, spam monitoring, DA trend tracking.
4. AgencyAnalytics
AgencyAnalytics connects Ahrefs, Semrush, Google Search Console and Google Analytics into one white-label dashboard. Automated monthly reports pull live data and land in the client’s inbox without manual assembly.
Best for: Agencies managing multiple clients who need branded, automated delivery.
5. Google Sheets and Looker Studio
Free, fully owned and more flexible than most paid options for reporting. Google Sheets handles the link log. Looker Studio turns it into a live dashboard connected to Search Console.
Best for: Teams that want full control of their reporting stack without a monthly subscription.
Five Reporting Mistakes That Cost Retainers
Link building programs produce better results than their reports suggest. These are the five patterns that create that gap.
1. Reporting link volume without quality context
A total link count with no DR range, link type split, or topical relevance data gives the client nothing to hold onto. Fifty links from irrelevant DR 20 sites looks like activity, not progress.
2. Leaving out lost links
If you built 12 links and lost 15 DR 60+ referring domains, the referring domain count dropped. Show it first, with a recovery plan attached. Clients notice the ranking impact before they notice the report gap.
3. Treating links and rankings as two separate stories
Link tables followed by ranking tables with no connection between them confuse non-SEO readers. Map each target page’s link activity directly to its ranking change – one continuous story, not two sections stapled together.
4. Switching tools between reports
Moving from Ahrefs DR to Moz DA mid-campaign creates apparent drops and spikes that are just metric differences. Lock in one tool from report one and keep it there.
5. Sending early-stage reports with no timeline anchor
A month-two report showing links placed and no ranking movement with zero explanation of expected timelines, is how retainers end early. The 3-to-6 month window needs to appear in every report until results arrive.
Frequently Asked Questions
What should a link building report include?
An executive summary, link log with DR and anchor text, referring domain growth, anchor text distribution, lost links, rankings and traffic per target page and a goals tracker.
How often should you send a link building report?
Monthly for agencies and freelancers. Quarterly for leadership rollups. A live Looker Studio dashboard covers the gaps in between for in-house teams.
What is the best format for a link building report?
Match the format to the reader. A non-SEO client needs plain language, a ranking snapshot and a verdict they can share with their team.
An in-house SEO lead wants full metrics, anchor distribution and competitive context. An agency director needs pipeline status and cost-per-link data.
How do you show ROI in a link building report?
Map acquired links to ranking improvements on target pages. Then connect those pages to traffic and conversion data from Google Analytics.
A link that moved a product page from position 14 to position 6 for a 2,000-volume keyword has a calculable traffic value. Attach an estimated revenue figure using the client’s conversion rate and average deal size. That is the language that keeps budgets intact.
What tools are best for link building reporting?
Ahrefs for backlink data and lost link tracking.
Semrush for anchor text analysis and competitive gaps.
Google Search Console for organic traffic and rankings, free and more accurate than third-party estimates.
Looker Studio with Google Sheets builds a live dashboard at no cost.

