


Infographics have become more than just eye-catching visuals; they’re one of the most effective ways to earn quality backlinks in today’s content-driven world.
When done right, they simplify complex information, attract shares, and naturally earn mentions from websites looking for credible, engaging resources.
In 2025, with more content competing for attention, infographic link building is all about smart execution. It’s not just about design, it’s about finding the right angle, targeting the right platforms, and pitching to the right people.
This guide walks you through the strategies, types, and outreach tips you need to make infographics work for your link-building goals.
Whether you’re doing this for your site or as part of a broader SEO campaign, you’ll find actionable steps to get noticed and linked.
What is infographic link building?
Infographic link building is a strategy where you create eye-catching visual content, such as infographics, to earn backlinks from other websites.
You take useful data or insights and present them in a visually appealing infographic. Then, you share it with content creators, such as bloggers, journalists, or niche websites.
It’s a form of organic link building in a natural way; you’re not buying links or using manipulative tactics. Instead, you’re offering value through visual storytelling that others want to reference.
According to Adam Connell, 34.3% of marketers say that 20% to 50% of their content includes visuals, while just 16.2% use visuals in less than 20% of their content.
This shows how essential visuals like infographics have become in content strategies that aim to drive links and engagement.
Infographics are no longer optional; they’re part of the link-building playbook for brands that want to stand out, whether through fresh outreach or smart niche edits that place your visuals in relevant, high-quality content.
Did you know?
Infographics are more likely to be read than plain text articles. That’s why websites love linking to them; they’re easy to understand and share!
Let’s turn your content into backlinks. Check our link-building services.
Why use infographics for your link-building campaign
To be honest, getting quality backlinks isn’t easy.
You reach out. You pitch. You wait. But what if you could make your content link-worthy from the start?
Infographics aren’t just eye-catching; they’re link magnets.
Some studies suggest that blog posts with infographics attract up to 178% more backlinks than those without. Even if that number varies, the takeaway is clear: people love linking to visual content.
Why does it work so well?
Infographics do more than just decorate your page.
They simplify complex ideas, enhance storytelling, and add real value to the linking content.
Here’s something to think about:
According to reports, 65% of people are visual learners, making visual content an essential part of any marketing strategy.
What’s more, marketing data shows that visual content gets 94% more views than text-only posts, highlighting how effective it is at capturing attention and boosting engagement.
But there’s more.
Infographics also improve user experience, which plays a role in SEO rankings.
The result?
More shares. More backlinks. More traffic.
What is Guestographics?
Guestographics is the same infographic-based link-building strategy we’re discussing in this article. It combines infographics with guest posting.
You design a valuable infographic, reach out to websites in your niche, and ask if they’d like to share it. To make the offer more appealing, you also provide a custom guest post that includes the infographic.
To avoid confusion, we’ve added a quick note about Guestographics. The term and technique were introduced by Venngage.
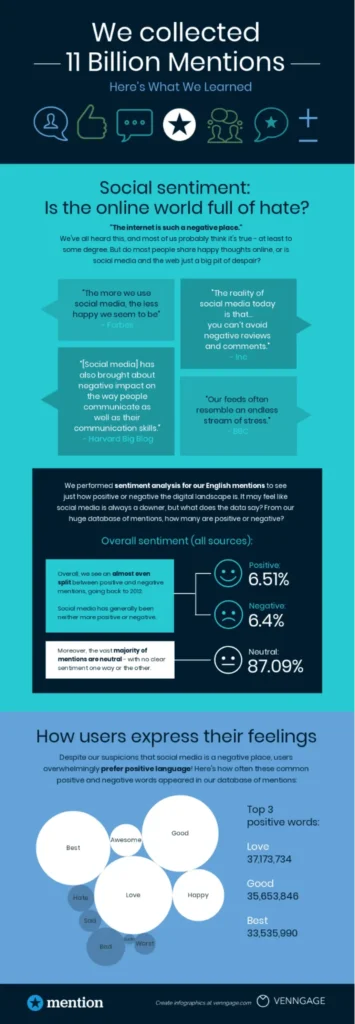
For instance, Venngage teamed up with Mention to create the infographic below as part of their Guestographics strategy to improve SEO.
Now let’s go back to our topic.
7 Types of infographics you can use for link building
Not all infographics are the same. Depending on your message, topic, or data, you can choose from different formats.
Each type serves a different purpose, and the right one can make your content more engaging, more shareable, and much easier to link to.
1. Timeline Infographics

These show events or data points in the order they happened, perfect for telling a story over time.
Use them to highlight a journey, project timeline, or historical events like the evolution of Google’s algorithm in this well-known example from HubSpot.
They’re especially useful for educational content, industry trends, or product updates that unfold over years.
2. Statistical Infographics

Ideal for turning numbers into visuals. These use graphs, charts, and icons to make stats and research findings easier to digest.
A great example? The World Bank’s infographic on climate change data is clear, impactful, and highly shareable.
You can also use them to showcase internal survey data, which adds credibility and attracts niche-specific backlinks.
3. Comparison Infographics

These put two or more items side by side to show their differences or similarities.
They’re great for helping people make choices, like this infographic from Honestly that compares Employee Benefits vs. Employee Satisfaction Surveys.
Comparison visuals are especially popular in product marketing, software reviews, or “X vs Y” blog posts, where clarity drives action and often supports affiliate link-building strategies by helping users decide which product to buy.
4. Process Infographics

Break down a process step by step using simple visuals. They’re excellent for tutorials, guides, or how-to content.
Check out this one from Venngage, it walks you through the entire infographic design process in a clean, easy-to-follow way.
These are perfect for simplifying technical processes or onboarding steps in industries like SaaS, education, or finance.
5. Geographic Infographics

Use maps to share data based on location. These work well for comparing regions, showing population trends, or highlighting global stats.
One standout example is MoveHub’s infographic on what people around the world value most in life.
They can also be used to highlight business expansion, customer demographics, or regional performance.
6. Hierarchical Infographics

These organize information from top to bottom, ranking items by importance.
Often shaped like pyramids or trees, they’re useful for organizational charts, rankings, or levels like the classic Maslow’s hierarchy of needs by Bitesize Learning.
These infographics work great when you need to explain structure, from company teams to content strategies to user segmentation.
7. List Infographics

Quick, clear, and scrollable list infographics are great for summarizing tips or must-know facts.
For example, Visme’s infographic on SEO content tips is a great way to present bite-sized advice visually.
They are highly versatile and often used for social media content, checklists, or blog post summaries.
Did you know?
Infographics can increase website traffic more than other types of content just by being more shareable and engaging!
Plus, visual content is more likely to be shared on social media, making infographic backlinks a smart long-term SEO investment.
How to create a powerful infographic that attracts backlinks
Now that you know what infographic link building is and why it works, let’s walk through how to create one that gets attention—and backlinks.
1. Start with a strong concept
Before designing anything, you need a solid topic. The right idea will make your infographic naturally shareable and link-worthy.
Repurpose existing content
Already have high-performing blog posts? Turn them into infographics!
• Research posts → statistical infographics
• How-to guides → process infographics
• Comparisons → comparison infographics
Start with blog posts ranking between positions 5–20. A visual boost might help them break into the top 3.
Analyze competitor content
Use tools like Ahrefs Site Explorer to find infographics your competitors are earning links from.
In the Backlinks report, filter links pointing to image files (.jpg, .png, .svg, .webp).

Notice recurring topics or formats? Use those insights to create something better or combine popular ideas into one comprehensive piece.
Even if your competitors didn’t use infographics, look at the most linked pages on their sites. Can you turn similar content into a visual version? Stat roundups and industry trends work especially well.
Follow search trends
Tools like Exploding Topics or Answer the Public help you find what’s hot in your niche.

If you search “AI” and spot trending topics like AI story generators or AI music tools, you can create an infographic listing top tools or comparing their features.
Use infographic directories for inspiration
Sites like Visual.ly showcase thousands of infographic examples across niches.

Browse by tags like /tag/SEO or /tag/marketing to find trending ideas and successful formats.
Using existing data
Original research works best, but if you don’t have the time or budget, don’t worry.
You can build a great infographic using secondary sources. Just ensure you update the data, cite credible references, and present it freshly.
Writers often link to the version that’s most clear and current, not necessarily the source.
2. Design the infographic
Once your data and idea are ready, it’s time to visualize them.
You have a few options:
• Hire a freelancer on Fiverr or Upwork (usually $20–$30/hr)
• Use an in-house designer for brand consistency
• Do it yourself on Canva or Visme using templates

Design tips for infographic success:
✅ Keep it clear and simple – Avoid cluttered layouts or too much text
✅ Create visual hierarchy – Use size, color, and spacing to highlight key info
✅ Use relevant icons and images – Match the visuals to the message
✅ Choose the right colors – Make sure they’re readable and emotionally on-point
✅ Stay on-brand – Use fonts, logos, and colors your audience recognizes
3. Optimize it for SEO
To help your infographic rank in search engines and earn links over time, optimize both the image and the page it’s on.
Here’s how:
• Rename the image file with keywords (e.g., seo-trends-2025-infographic.png)
• Add keyword-rich alt text (e.g., “Infographic showing 2025 SEO trends including AI tools and voice search”)
• Include a short intro or summary around the infographic in the blog post
• Don’t skip on title tags, meta descriptions, and internal links
Pro Tip:
When HubSpot optimized its image alt text in 2018, it saw a 779% jump in image traffic within 12 months!
4. Launch a targeted outreach campaign
You’ve published your infographic – great! Now it’s time to get it in front of the right people.
Step 1: Find prospects
Use Google searches like:
“lose weight” + “[infographic]”
Then filter results by domain rating (30+), traffic (100+), and language.

Step 2: Gather contact info
Upload your prospect list to Hunter.io. Use its Bulk Domain Search to pull verified email addresses.
Export them as leads, ready for outreach.
Step 3: Write an outreach email
A good email can make all the difference.
Tips for writing it:
• Keep the subject line short and specific (4–7 words)
• Personalize the message by mentioning their content or website
• State the benefit: Why would their readers care about your infographic?
• Add a direct link to view it
• Keep it under 100 words
• Use white space or bullets for easy reading
Example CTA:
“Would you be open to including this in your article? I think it would add value for your readers.”
Step 4: Follow up
One email often isn’t enough.
• Send 1–3 follow-ups spaced 2–5 days apart
• Keep them friendly and to the point
• You can automate this using Hunter.io’s sequence feature
5. Promote it on social media
Don’t rely on outreach alone; infographics are made for social.
Break your infographic into short snippets or sections and repurpose them as carousel posts, Pinterest pins, or LinkedIn slides.
Add hashtags, tag collaborators, and consistently reshare these actions; not only boost visibility but can also lead to social backlinks, as others reference or link to your content from their profiles or blogs.
📊 Quick insight:
The visual content marketing industry is booming; it’s projected to hit $10.6 billion by 2024. Over the past year alone, demand for visual assets has grown by 40%, showing just how vital infographics and visuals have become in driving engagement and brand communication.
Conclusion
Infographic link building in 2025 remains a powerful, evergreen strategy for earning authoritative backlinks and boosting your SEO.
But success doesn’t come from just designing a great visual; it comes from strategic promotion, smart outreach, and understanding what your target audience values.
With the right approach, your infographics won’t just sit pretty; they’ll drive real SEO results.
Use this guide to refine your process, avoid common issues, and turn creative ideas into high-impact links.
Need help with link building?
We offer link-building services designed to deliver lasting results. Whether you need support with infographic outreach or a full-service strategy, contact us to discuss how we can support your goals.
FAQ about infographic link building
Do infographics help with SEO?
Yes. Infographics help generate high-quality backlinks, which are a major ranking factor in SEO. They also improve user experience by making content easier to read and understand, which can reduce bounce rates and increase time on site, both positive signals for search engines.
What type of infographics work best for backlinks?
Statistical, process, and comparison infographics are among the most effective. They offer clear, actionable insights and are often cited in research, how-to guides, and product reviews. However, the “best” type depends on your topic and audience.
Do I need to create original data for my infographic?
Not necessarily. While original research can boost credibility, you can create effective infographics using curated data from trusted sources—just make sure to cite them properly. What matters most is presenting the information in a fresh, valuable, and easy-to-understand way.
Where can I promote my infographic to earn links?
You can promote it through targeted outreach to bloggers, journalists, and niche content creators. Additionally, share it on social media, infographic directories (like Visual.ly), and include it in guest posts or newsletters. Outreach combined with social sharing increases your chances of earning quality backlinks.
How do I track the performance of my infographic?
Use tools like Google Analytics and Ahrefs to track referral traffic, backlinks, and engagement metrics. You can monitor how many sites are linking to your infographic, how much traffic it brings in, and which channels are driving the most engagement.


