




Project MRR growth, measure CAC payback and see how churn and expansion affect recurring revenue.
This free SaaS growth calculator helps you estimate monthly recurring revenue, MRR growth and CAC payback in one place. It gives you a faster way to judge whether revenue is becoming more durable or simply being replaced every month.
Our calculator brings MRR growth, churn, expansion and CAC payback into one view. That makes it easier to see whether new revenue is compounding or replacing what you lost.
[SAAS REVENUE CALCULATOR]
The sections below explain how to calculate SaaS revenue manually, read the result and decide which metric needs attention.
How to Use Our SaaS Revenue Calculator
Unlike a basic MRR calculator, our tool also shows CAC payback and the effect of churn and upsells.
Enter six values mentioned in the table below and select Calculate Revenue:
| Input | What to Enter |
|---|---|
| Starting Customers | Active paying customers at the beginning of the month |
| Monthly New Customers | New paying customers added during the month |
| Average Revenue Per Customer | Average monthly recurring revenue generated per customer |
| Monthly Churn Rate | Percentage of existing customers lost during the month |
| Monthly Upsell Rate | Percentage of revenue added through upgrades or expansion |
| Customer Acquisition Cost | Average cost of acquiring one new customer |
The results panel shows:
- Monthly recurring revenue
- MRR growth compared with the previous month
- Customer acquisition cost
- CAC payback period
- Formula used for the calculation
All values are used only for the calculation and are not stored.
Use the monthly recurring revenue calculator for three scenarios:
- Current case: Use your latest actual numbers.
- Downside case: Reduce acquisition and increase churn.
- Target case: Enter the numbers expected after planned improvements.
The difference between the current and target cases shows which variable has the greatest effect on revenue.
How to Calculate SaaS Revenue
To understand how to calculate SaaS revenue, separate recurring revenue into four parts:
- Revenue retained from current customers
- Revenue added through new customers
- Revenue gained through upgrades
- Revenue lost through churn or contraction
An MRR calculator performs this calculation automatically. The formulas below show how to work it out manually.
MRR Formula
Monthly recurring revenue is the predictable subscription revenue generated each month.
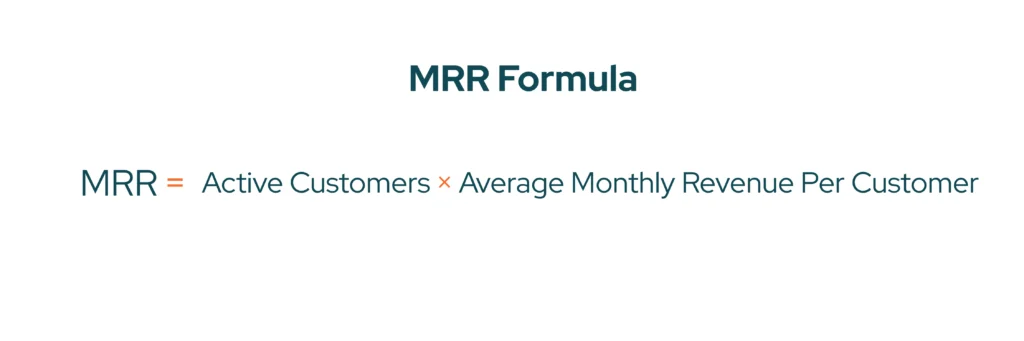
The basic MRR formula is:
MRR = Active Customers × Average Monthly Revenue Per Customer
For example, 400 customers paying an average of $75 per month produce:
400 × $75 = $30,000 MRR
Do not include setup fees, consulting revenue, or one-time purchases. They are revenue, but they are not recurring revenue.
When customers pay annually, divide the contract value by 12.
A $12,000 annual contract contributes $1,000 to MRR.
ARR Formula
Annual recurring revenue converts monthly recurring revenue into an annual run rate.
ARR = MRR × 12
A business with $30,000 MRR has:
$30,000 × 12 = $360,000 ARR
You can use an ARR calculator when you need a quick annual view for planning, fundraising, or board reporting.
ARR does not show what changed during the month. Review the MRR movement before drawing conclusions from the annual figure.
Net New MRR Formula
Net new MRR shows whether acquisition and expansion are adding more revenue than churn removes.
Net New MRR = New MRR + Expansion MRR − Churned MRR
Suppose a SaaS company records:
- $5,000 in new MRR
- $2,000 in expansion MRR
- $3,500 in churned MRR
Its net new MRR is:
$5,000 + $2,000 − $3,500 = $3,500
That is the amount added to the previous month’s MRR.
A positive result means recurring revenue grew. A negative result means churn and contraction removed more revenue than acquisition and expansion added.
MRR vs ARR: What to Use When
MRR and ARR describe recurring revenue across different periods. Read below to know what to use when:
| Use MRR For | Use ARR For |
|---|---|
| Monthly operating reviews | Annual planning |
| Churn analysis | Fundraising discussions |
| Acquisition performance | Board reporting |
| Expansion tracking | Revenue targets |
| Short-term forecasting | Company-level benchmarking |
MRR gives operators more detail. ARR gives investors and leadership a faster annual summary.
Use both, but never present ARR without understanding the monthly revenue movement behind it.
What Is a Good MRR Growth Rate?
A good MRR growth rate depends on company size, funding stage, market and starting revenue.
Smaller SaaS companies can grow faster because they are working from a smaller base. A company moving from $10,000 to $20,000 MRR grows by 100%. A company adding the same $10,000 to $500,000 MRR grows by only 2%.
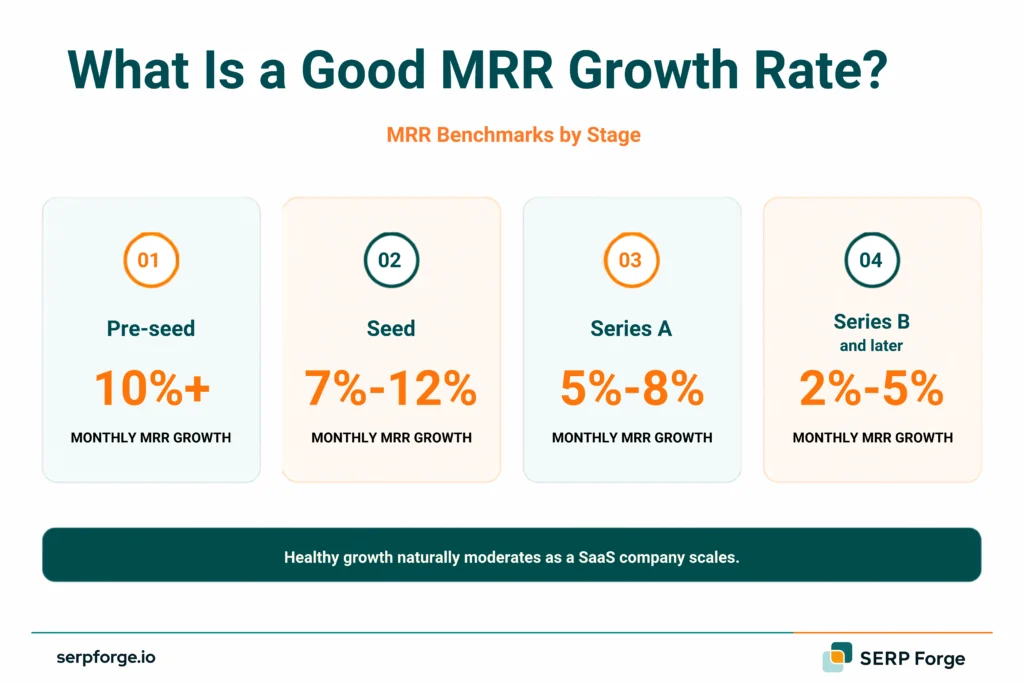
MRR Benchmarks by Stage
Use these ranges as directional checks rather than fixed fundraising rules:
| Stage | Monthly MRR Growth | What It Usually Means |
|---|---|---|
| Pre-seed | 10%+ | Early traction from a small base |
| Seed | 7%–12% | Product demand is becoming repeatable |
| Series A | 5%–8% | Acquisition and retention are starting to scale |
| Series B and later | 2%–5% | Growth continues from a much larger base |
A founder should not chase a percentage without checking where the growth came from.
Ten per cent monthly growth driven by discounts and high churn may be less valuable than 6% growth from retained customers and healthy expansion.
MRR Benchmarks by Industry
Different products grow differently because pricing, sales cycles and churn patterns vary. Here is the growth pattern for each:
| SaaS Model | Typical Growth Pattern |
|---|---|
| Self-service SaaS | Faster acquisition with higher customer churn |
| SMB SaaS | Moderate contract values and shorter sales cycles |
| Mid-market SaaS | Slower acquisition with higher account expansion |
| Enterprise SaaS | Uneven monthly growth due to larger contracts |
| Vertical SaaS | Slower market expansion with better retention |
Compare your company with businesses selling to similar customers through a similar pricing model.
A $20-per-month productivity app should not use the same growth expectations as a $100,000 enterprise platform.
When Slower Growth Is Still Healthy
Slower MRR growth can still be healthy when:
- Churn is falling
- Customers are moving to annual plans
- CAC payback is improving
- Expansion revenue is increasing
- Growth is becoming less dependent on discounts
Investors will look beyond the MRR line. They will want to know how much revenue stays, what acquisition costs and how efficiently existing accounts expand.
Key SaaS Revenue Metrics to Track Alongside MRR
MRR shows the size and direction of recurring revenue. The metrics below explain its quality.
Customer Lifetime Value
Customer lifetime value estimates how much revenue or gross profit a customer generates before leaving.
A simple version is:
LTV = Average Revenue Per Customer ÷ Monthly Churn Rate
Use gross profit instead of revenue when you need a more realistic financial view.
Customer Acquisition Cost
CAC measures how much sales and marketing spend is required to acquire one new customer.
CAC = Total Sales and Marketing Spend ÷ New Customers
Track CAC by channel where possible.
A blended average can hide an efficient referral programme and an expensive paid campaign.
Churn Rate
Customer churn measures the percentage of customers lost during a given period.
Customer Churn = Customers Lost ÷ Starting Customers × 100
Revenue churn may tell a different story when larger customers cancel or downgrade.
Net Revenue Retention
NRR shows how recurring revenue from existing customers changes after expansion, contraction and churn.
NRR = (Starting MRR + Expansion − Contraction − Churn) ÷ Starting MRR × 100
An NRR above 100% means the existing customer base is growing without new acquisition.
LTV to CAC Ratio
The LTV:CAC ratio compares expected customer value with acquisition cost.
A ratio near 3:1 is commonly treated as healthy. Below that level, acquisition may be too expensive.
A very high ratio may mean the company is underinvesting in growth.
CAC Payback Period
CAC payback shows how many months it takes to recover acquisition cost.
CAC Payback = CAC ÷ Monthly Gross Profit Per Customer
A shorter payback period gives the company more freedom to reinvest in acquisition.
Rule of 40
The Rule of 40 combines annual revenue growth with profit margin.
Revenue Growth Rate + Profit Margin = Rule of 40 Score
A result of 40% or more suggests the company has a reasonable balance between growth and profitability.
This benchmark is more useful for established SaaS companies than very early startups.
How to Improve Your SaaS Revenue Growth
Work on retention before trying to buy more growth.
Reduce Churn
Separate churn by plan, customer size, acquisition channel and signup month.
Look for patterns.
A high overall churn rate may come from one poor-fit segment or one broken onboarding path.
Interview recent cancellations before building another retention campaign. Their reasons will usually tell you where revenue is leaking.
Improve Activation and Onboarding
Find the action that separates retained customers from customers who leave.
Then shorten the path to that action.
Remove unnecessary setup, provide templates and trigger help when users stop progressing.
More signups will not solve poor activation.
Expand Revenue From Existing Accounts
Expansion MRR is usually more efficient than acquiring another customer.
Create upgrade paths around real usage:
- Additional seats
- Higher limits
- Premium features
- New departments
- Related modules
Ask for the upgrade when the customer has experienced enough value to understand why it is useful.
Want to Know What Is Limiting MRR Growth?
We can review your acquisition, churn, expansion and CAC data to find the metric creating the largest revenue drag.
Review My SaaS Revenue
FAQs
What Is a Good MRR for an Early-Stage SaaS?
There is no universal minimum. Consistent growth, low churn and evidence that customers will keep paying are more useful than one MRR number.
What Is the Difference Between MRR and ARR?
MRR measures recurring revenue each month. ARR multiplies that figure by 12 to show the annual run rate.
How Does Churn Affect SaaS Revenue?
Churn removes customers and recurring revenue from the starting base.
When churned MRR is greater than new and expansion MRR, revenue falls even if the company keeps acquiring customers.
What Is Net Revenue Retention and Why Does It Matter?
NRR measures how recurring revenue from existing customers changes after upgrades, downgrades and cancellations.
A result above 100% means the customer base is expanding without new sales.
How Do I Calculate Expansion MRR?
Add the extra recurring revenue generated through upgrades, additional seats, higher usage and cross-sells during the month.
Do not include revenue from newly acquired customers.